
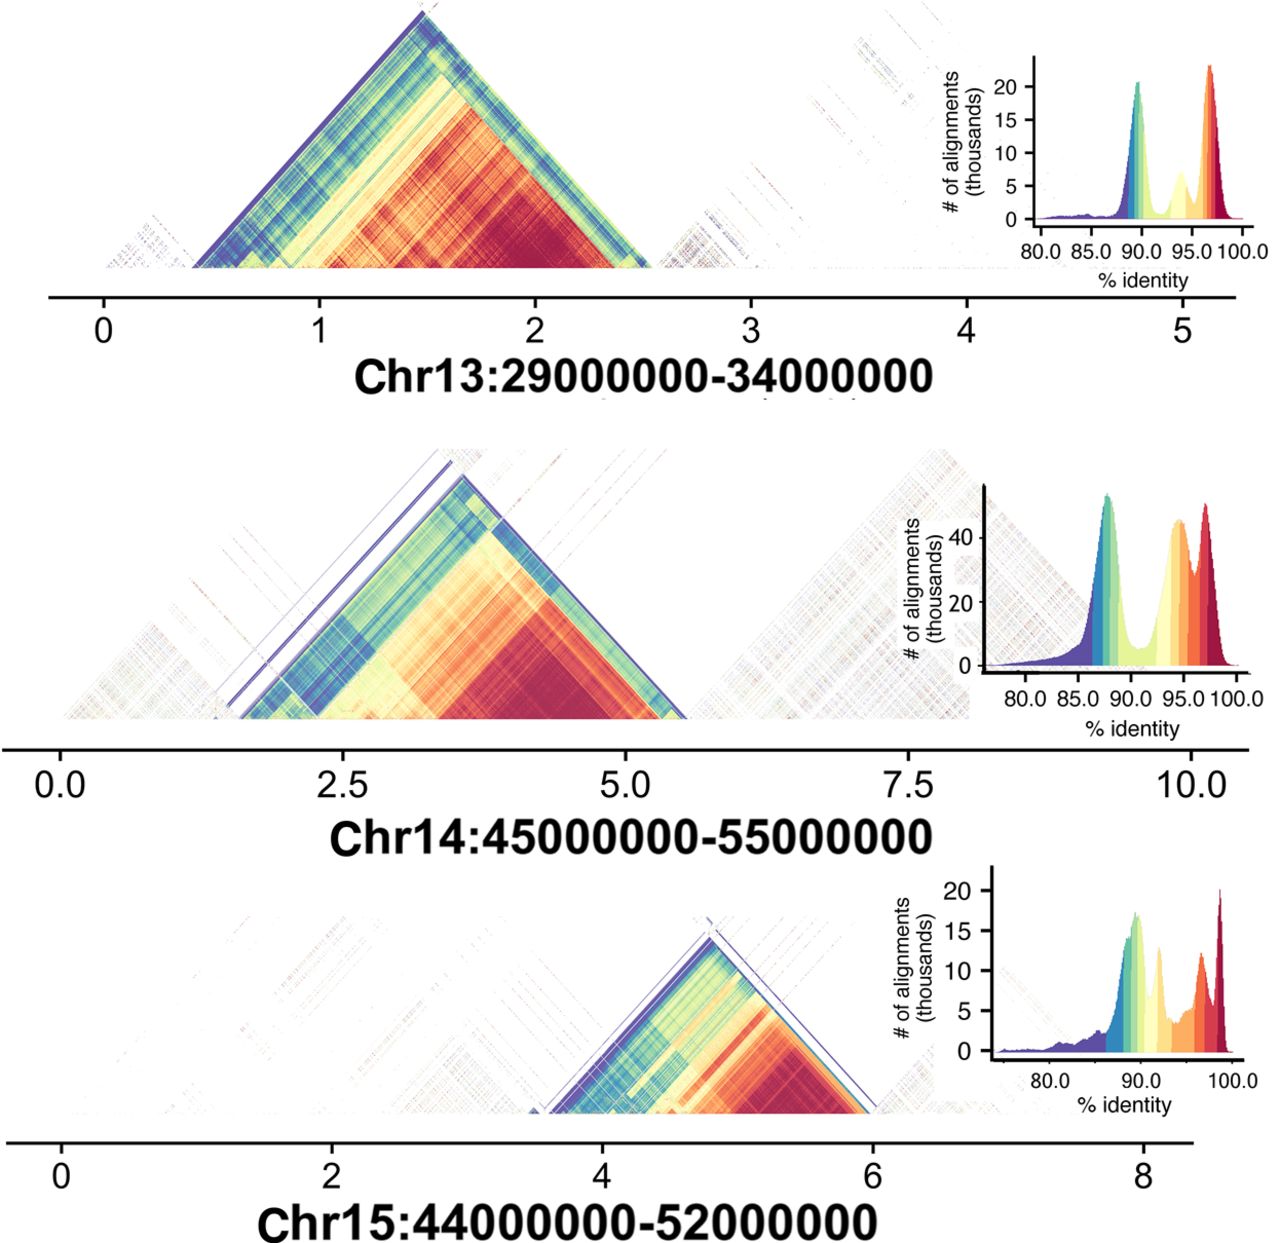
Figure 3.
We used the StainedGlass software tool to assess self-to-self similarity in regions of the chromosome in which the rat karyotype indicates the likely location of centromeric satellite sequences. The darkest red colors indicate near 100% identity, and purple colors indicate identity up to 90%. For each analysis, the distribution of self-similarity across the region is indicated in the graph relating number of alignments observed with the specified similarity. For illustration, we show regions of three metacentric chromosomes in which clear self-similarity is present. For more details on other chromosomes, see Table 1.


