
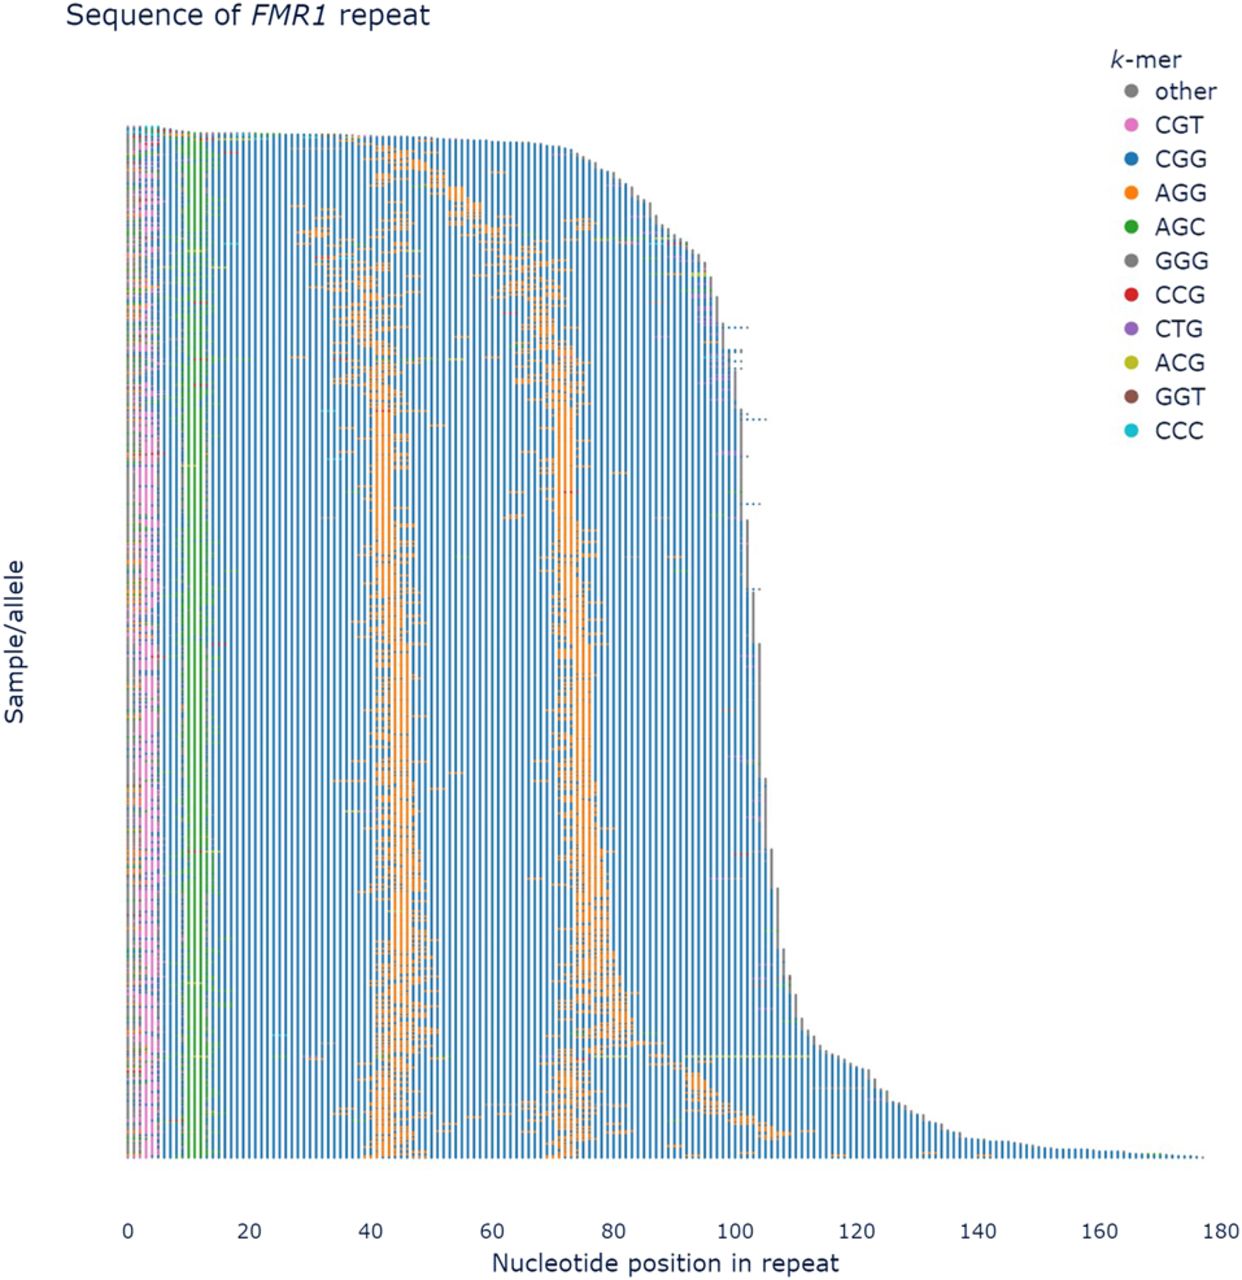
Figure 3.
pathSTR visualization of a sequence plot of the FMR1 repeat, showing colors for the most frequently seen motifs and gray for everything else, sorted by length. AGG motif interruptions (orange) between the CGG units (blue) can be observed.


