
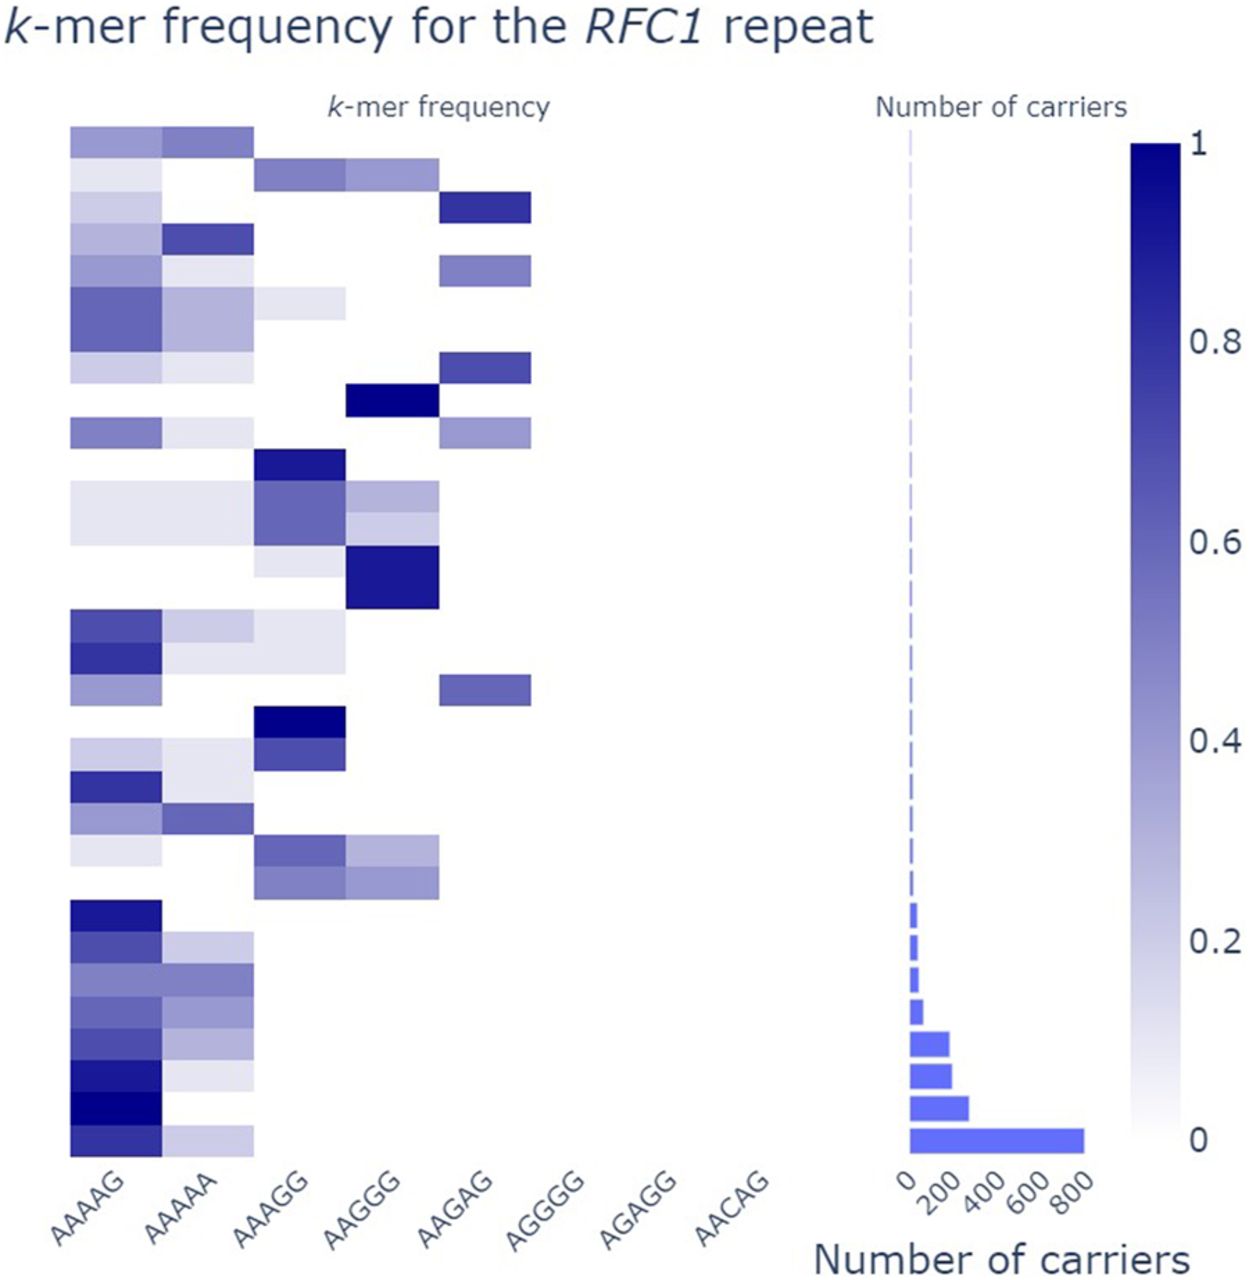
Figure 2.
pathSTR RFC1 composition visualization collapsed by motif, showing a marginal histogram to show the size of the groups while requiring at least five alleles per group.
(Downloading may take up to 30 seconds. If the slide opens in your browser, select File -> Save As to save it.)
Click on image to view larger version.
pathSTR RFC1 composition visualization collapsed by motif, showing a marginal histogram to show the size of the groups while requiring at least five alleles per group.
 CiteULike
 Delicious
 Digg
Digg Facebook
 Google+
 Reddit
 Twitter
