
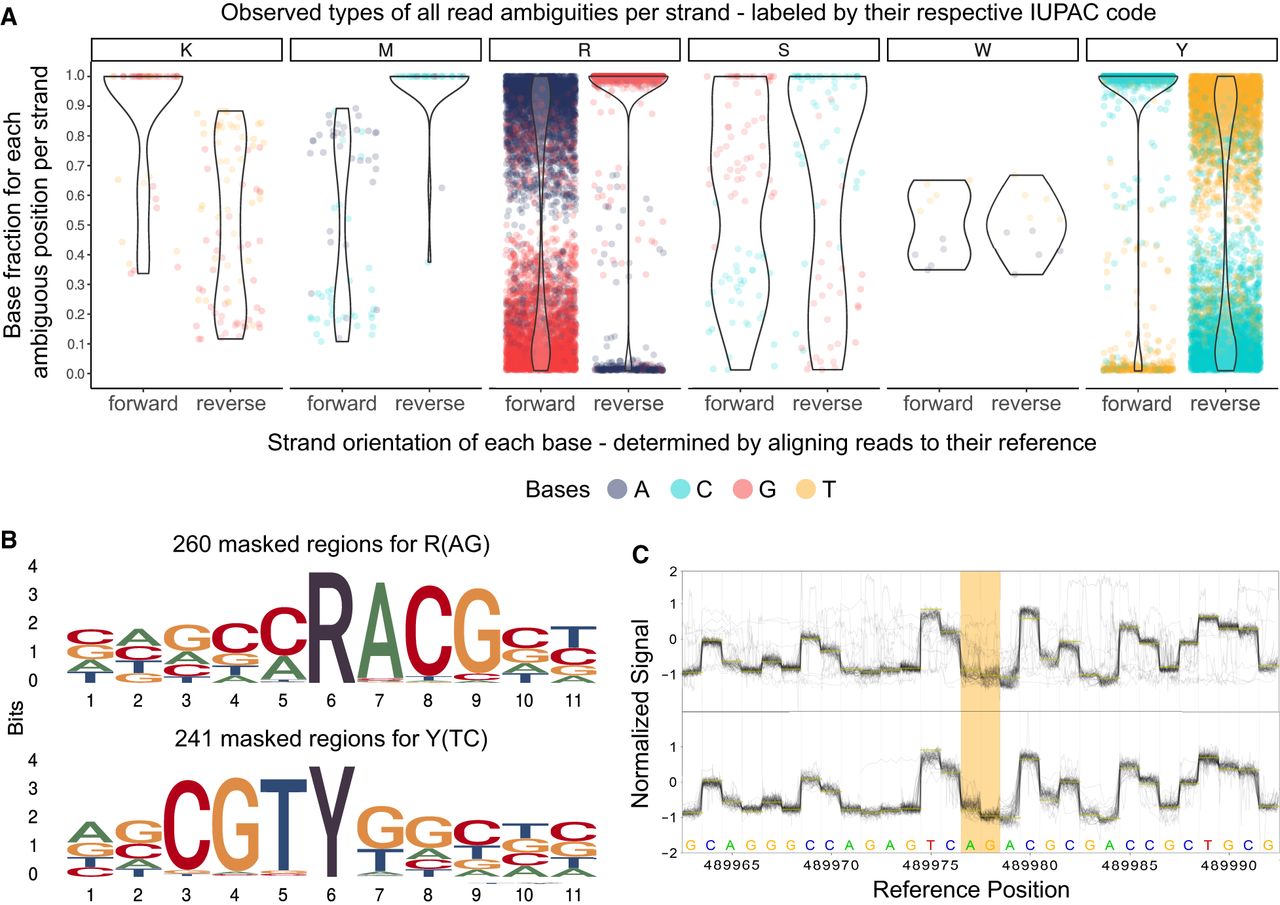
Systematic examination of ambiguous positions for frequency by strand orientation (A), conserved sequences (B), and raw Nanopore signal (C). (A) Violin chart showing the ratio between two bases within the mapped read data separated by strand orientation for 6556 ambiguous positions in 33 K. pneumoniae samples. Every ambiguous position is divided by which two bases appear and is labeled by their respective degenerative base (IUPAC nucleotide code). For example, “R” stands for a combination in which either A or G is found at that position. Each dot represents a base occurrence within the respective base combination at the ambiguous position. (B) Sequence logo of observed sequence pattern around the ambiguous bases R and Y on the chromosomal contig of K. pneumoniae for one sample. (C) Raw signal level (FAST5/POD5) of ambiguous positions (yellow) for Kit 14 (above) with methylated bases and SQK-RPB114.24 without modifications (below). Less clear signals are observable in ambiguous positions (yellow) for Kit 14. Signal plots were generated with remora (v.2.1.3; https://github.com/nanoporetech/remora).


