
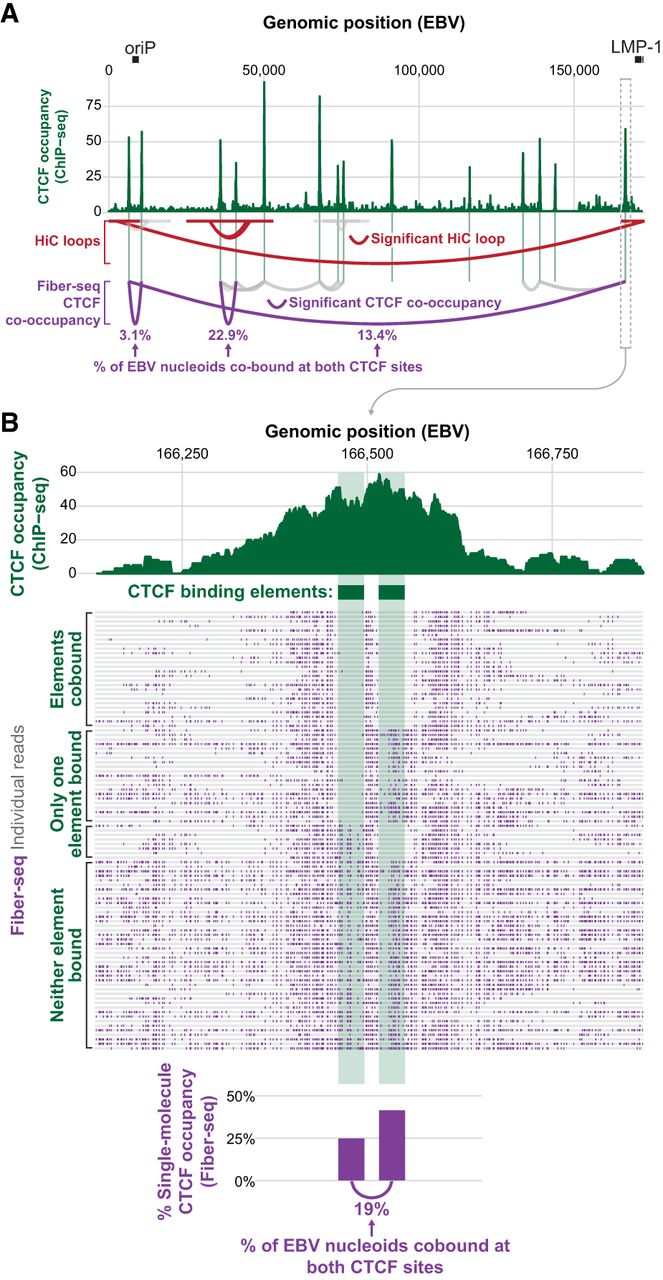
Figure 6.
CTCF co-occupancy along the EBV genome. (A) CTCF ChIP-seq (green), significant (red) or insignificant (gray) Hi-C loops (Morgan et al. 2022), and significant CTCF site co-occupancy by Fiber-seq (purple) along the EBV genome. The significance of CTCF site co-occupancy was determined by comparing the expected number of co-occupied fibers to the observed number using Fisher's exact test (for exact counts and P-values, see Supplemental Table S6). (B) Zoom-in of the indicated CTCF peak, which contains two CTCF binding elements. Single-molecule occupancy and co-occupancy from Fiber-seq are shown below.


