
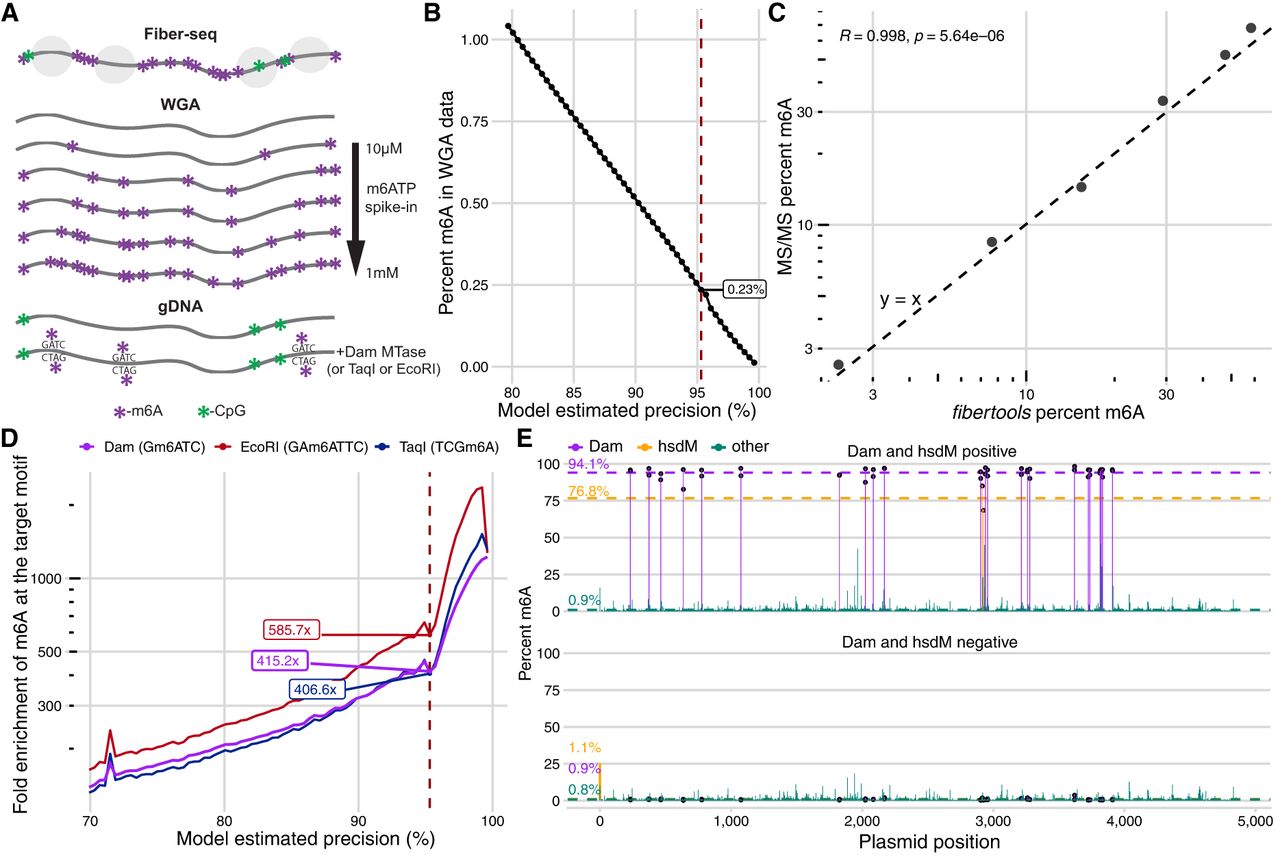
Biological validation of the semisupervised m6A caller. (A) Description of biological samples used for validation of fibertools. (B) Percentage of methylated adenines called by fibertools relative to all adenines in a whole-genome-amplified (WGA) negative control as a function of the estimated precision reported by fibertools. This serves as an estimate of the false-positive rate. The red line marks the default threshold used by fibertools. (C) Percentage of m6A as determined by UHPLC–MS/MS (y-axis) and fibertools (x-axis) at the default precision level for WGA samples with varying levels of m6ATP spiked-in. The text (upper left) indicates the value of the Pearson correlation coefficient and the P-value from a two-sided t-test without adjustment for multiple comparisons. (D) Enrichment of m6A calls within targeted motifs of three motif-specific methyltransferases (Dam [purple], EcoRI [red], and TaqI [blue]) as a function of fibertools estimated precision. (E) Methylation percentage at recognition sites for Dam (purple), HsdM (orange), and other sites (green) among all sequencing reads of a plasmid grown in a dam+/hsdM+ Escherichia coli strain (top) compared with a dam−/hsdM− negative control (bottom). Dotted lines show the average across each category.


