
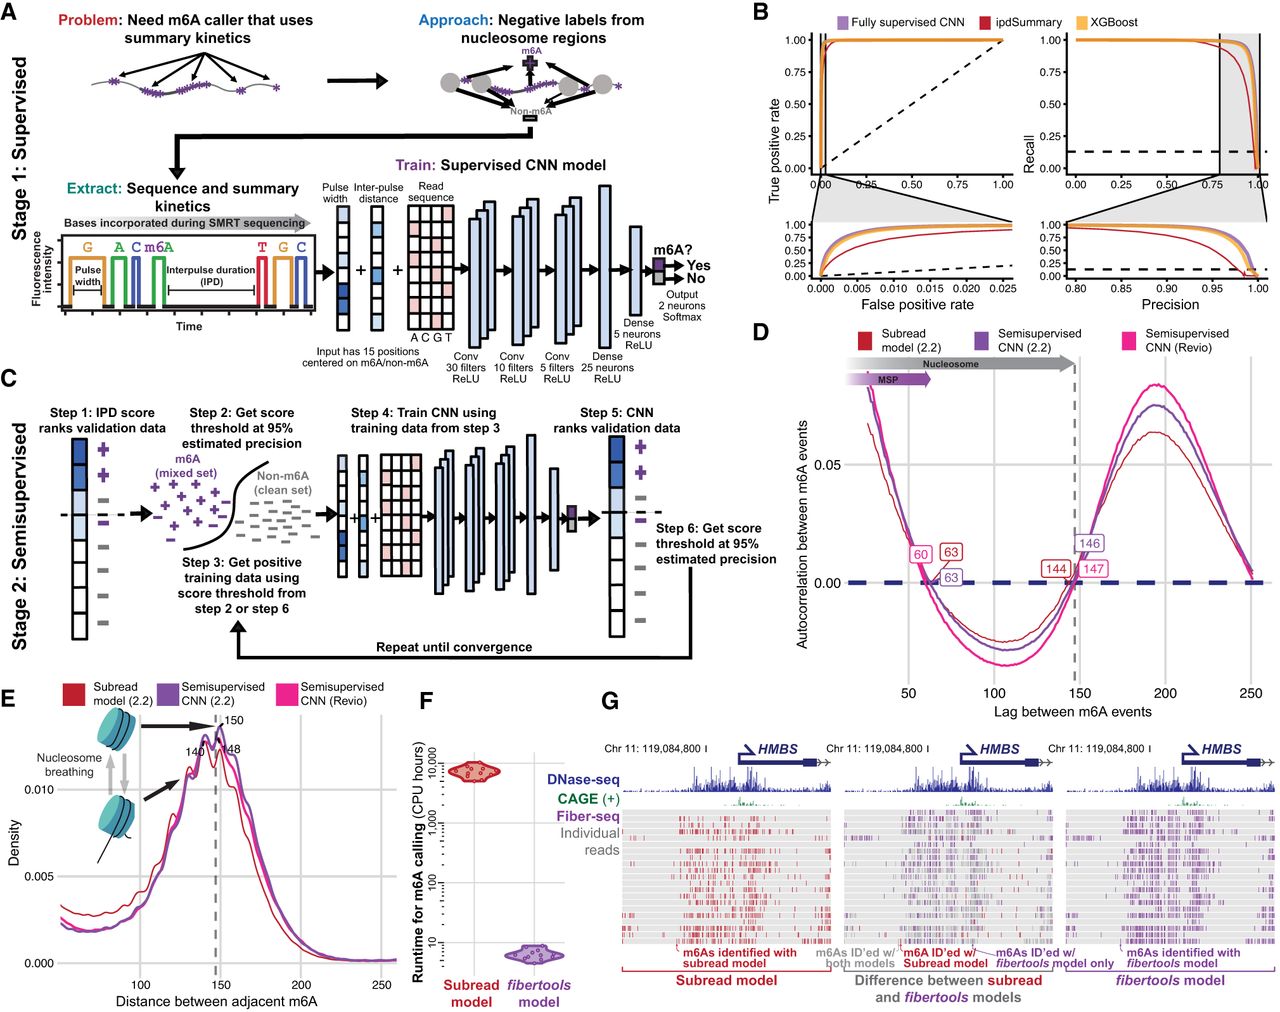
Accurate identification of m6A with supervised machine learning (ML) and refinement with semisupervised ML. (A) Methodology for generating training data and identifying m6A modifications using PacBio HiFi (for details, see Methods). (B) Receiver operating characteristic and precision-recall curves for the CNN (purple), XGBoost (orange), and ipdSummary (red) models. Dashed lines indicate the performance of a random classifier. (C) Methodology for semisupervised ML (for details, see Methods). (D) Autocorrelation between m6A calls made by the subread (red), semisupervised (purple), and Revio (pink) models. (E) Density of the distance between adjacent m6A on the same chromatin fiber (10,000 reads) for the same data sets and models as in D. (F) CPU hours used by fibertools (purple) and subread-based GMM model (red) for individual SMRT cells. fibertools was run with GPU acceleration (NVIDIA A40), which is unavailable for the GMM model. (G) Visualization of m6A calls in the HMBS locus that are unique to fibertools (purple), unique to the subread GMM model (red), or shared by both (gray). Reads are sorted by the number of CCS passes (low to high). DNase-seq (ENCODE July 2012 Freeze) and CAGE signals are shown above.


