
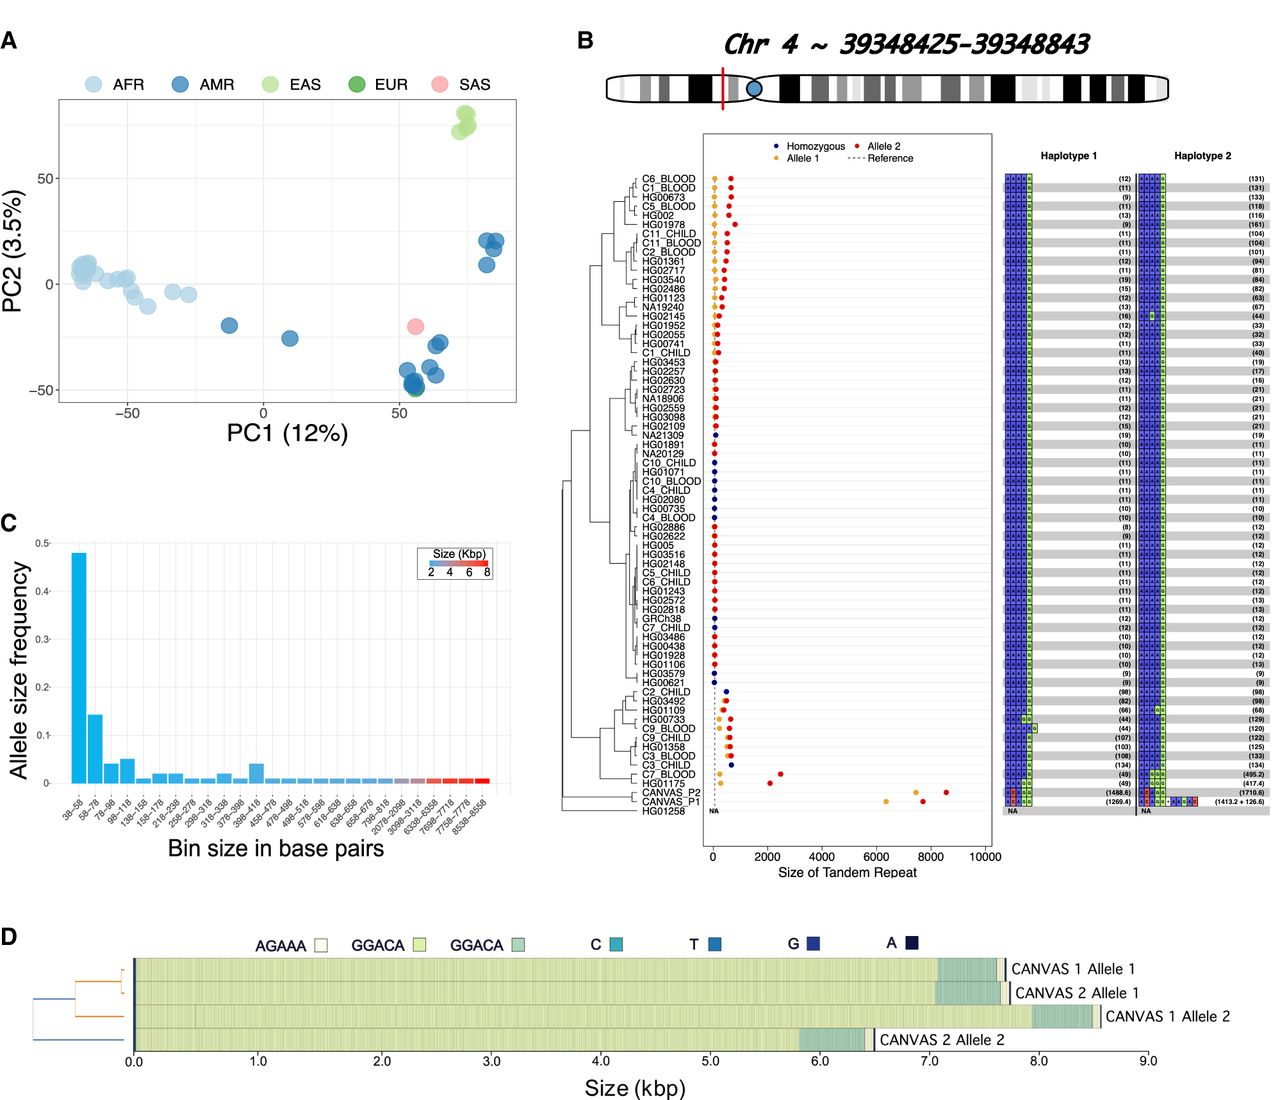
TREAT visualization and analysis modules. (A) The PCA of the ancestry-based analysis based on the 20% most variable TRs across 47 HPRC genomes. (B) The main TR is in the RFC1 gene. y-axis: individuals, x-axis: TR size (in bp). Blue dots: smaller allele, orange dots: larger allele, red dots: homozygous genotypes. Dashed line: the allele in the reference genome GRCh38. The right side of the plot reports, for each sample and each allele, the motif and relative number of copies. The TR lengths of the two CANVAS patients were identified as significant outliers compared to the length-distribution of 47 samples from the HPRC. (C) The distribution of allele sizes for the TR in RFC1 gene. (D) Motif representation in CANVAS patients, as produced with MotifScope (Zhang et al. 2024).


