
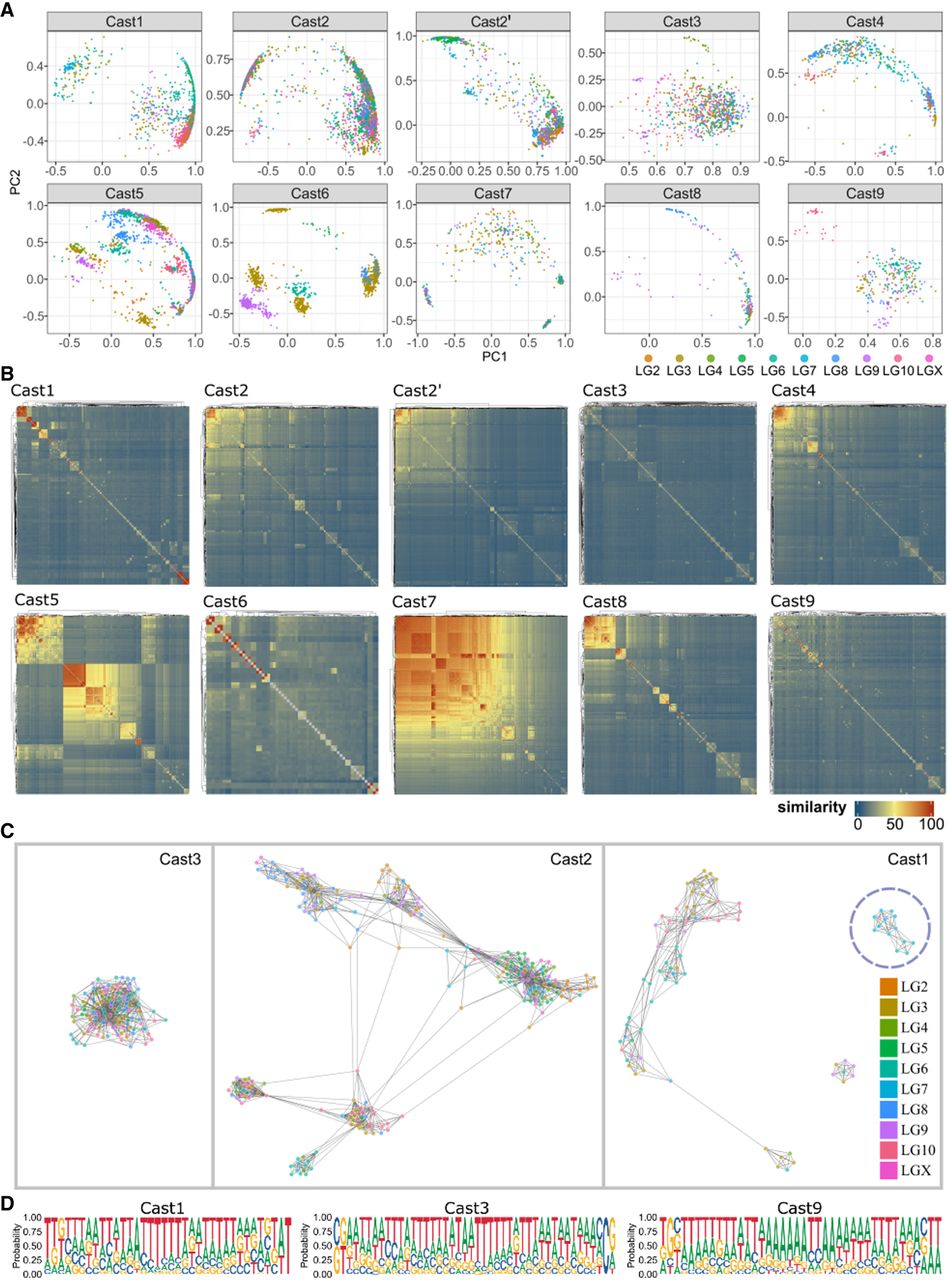
Evolutionary analysis of satDNA monomers and their junction regions. (A) Principal component analysis (PCA) of aligned Cast1–Cast9 satDNAs monomer distance matrices. Dots represent a monomer unit. Monomers were colored according to the chromosome of origin. The most prominent and recent exchange events between different chromosomes are visible in regions with high density of points with different colors. (B) Heatmap visualization of sequence similarity of 2 kb regions around Cast1–Cast9 arrays throughout the TcasONT assembly. The legend indicates that the sequence similarity of the surrounding regions increases, with colors going from blue to red. (C) Graph networks of Cast3, Cast2, and Cast1 arrays based on their sequence similarity relationship. Cast3 shows a cluster containing all arrays. Cast2 shows a pattern with six different clusters containing arrays mixed from different chromosomes. Cast1 shows no significant clustering of arrays, except small divergent clusters. (D) Sequence logo of junction regions of Cast1, Cast3, and Cast9 arrays in which an enrichment of poly(T) and poly(A) tracts can be recognized.


