
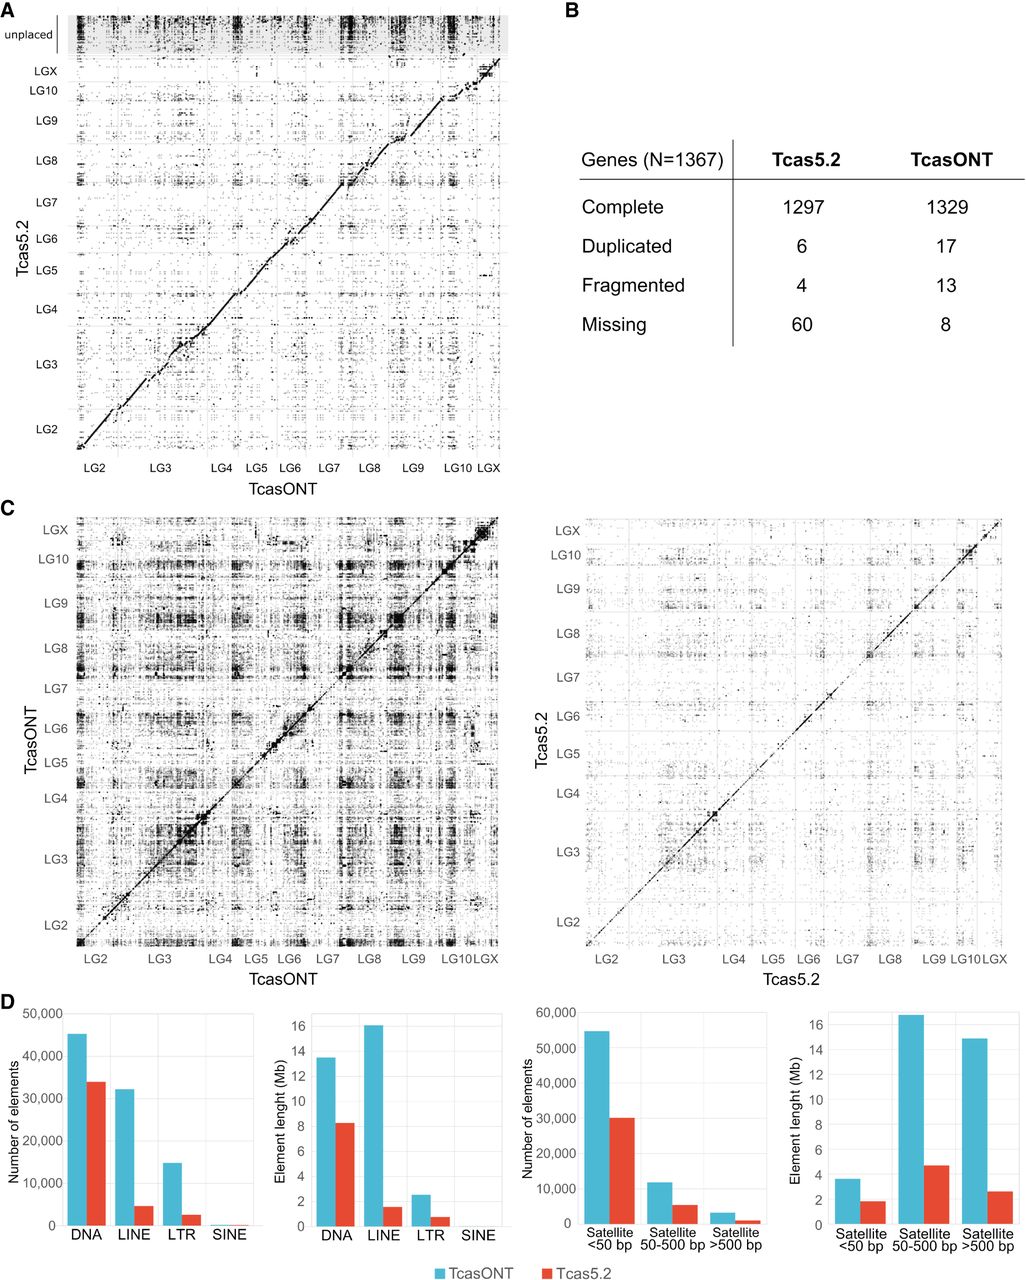
Assessment of T. castaneum assemblies. (A) Dot-plot representation of TcasONT versus Tcas5.2 assembly comparison. The horizontal axis corresponds to the intervals along the TcasONT assembly, and the vertical axis corresponds to the intervals along the Tcas5.2 assembly. LG2–LG10, including LGX, represent chromosomes, whereas unplaced contigs contain sequences in Tcas5.2. that were not associated with any chromosome. Dots closest to the diagonal line indicate colinearity between the two assemblies. (B) Gene completeness assessment based on BUSCO analysis of Tcas5.2 and TcasONT assemblies using insect universal orthologs. The analysis was expressed as absolute numbers for complete and single-copy, complete and duplicated, fragmented, and missing genes. (C) The whole-genome-to-genome dot-plot analyses of the TcasONT (left) and Tcas5.2 (right) assemblies. Each dot represents a region of ≥1000-bp-long region, which is mapped in its entirety to another part of the genome. The dot density is proportional to the number of highly similar regions. (D) Comparison of main classes of TEs (DNA, LINE, LTR, SINE) found by RepeatMasker and tandem repeats (TRs) with monomer lengths of <50 bp, 50–500 bp, and >500 bp found by TRF in the TcasONT and Tcas5.2 assemblies. The height of the bars indicates, from left to right, the total number of TEs or TRs and the cumulative length of TEs or TRs.


