
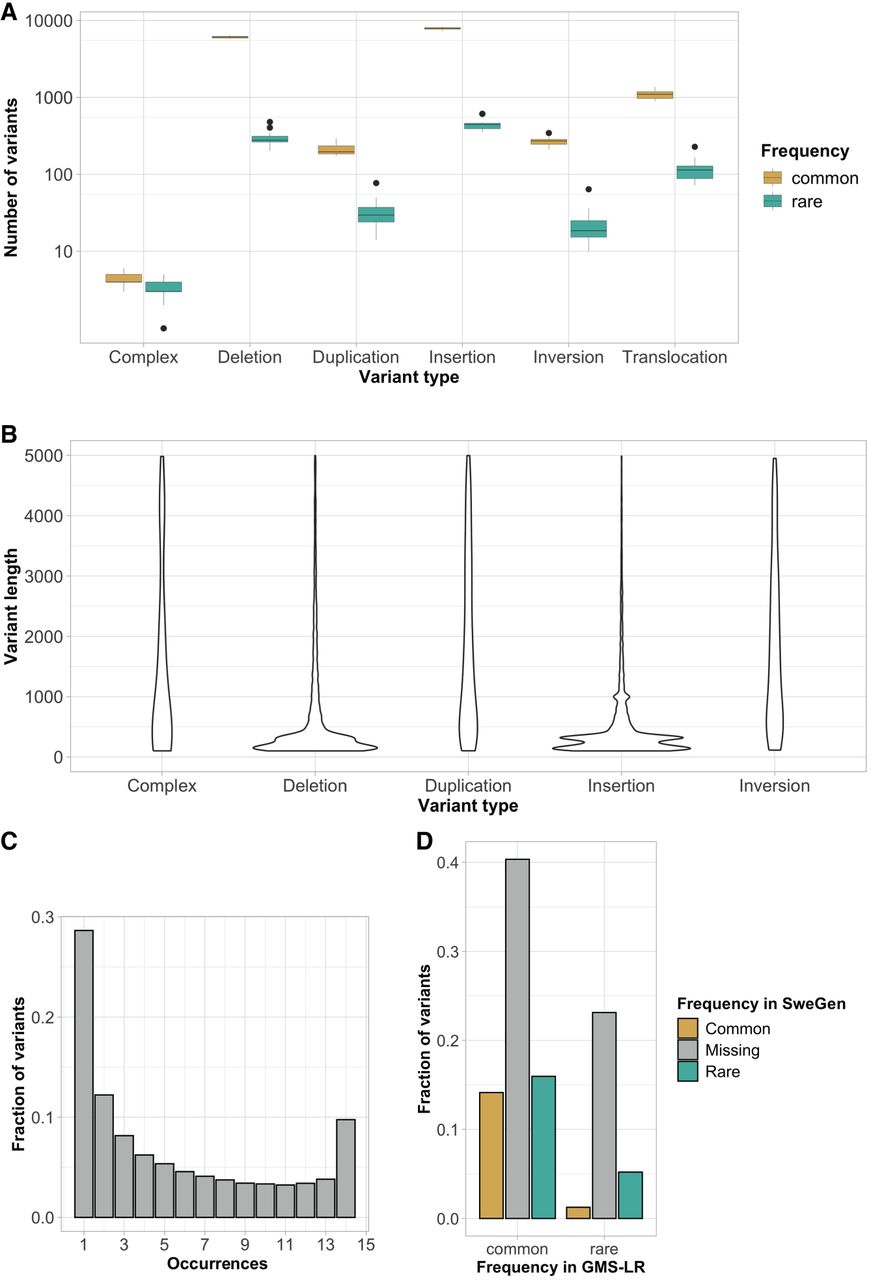
Figure 4.
Characterization of background SVs. (A) Boxplot illustrating the number of SVs per type (common in yellow and rare in green). (B) Violin plot of SV length per SV type (excluding SV > 5 kbp). (C) Allele frequency histogram. (D) Comparison of allele frequencies between the GMS long-read cohort and SweGen srGS SV database (common in yellow, missing in gray, and rare in green).


