
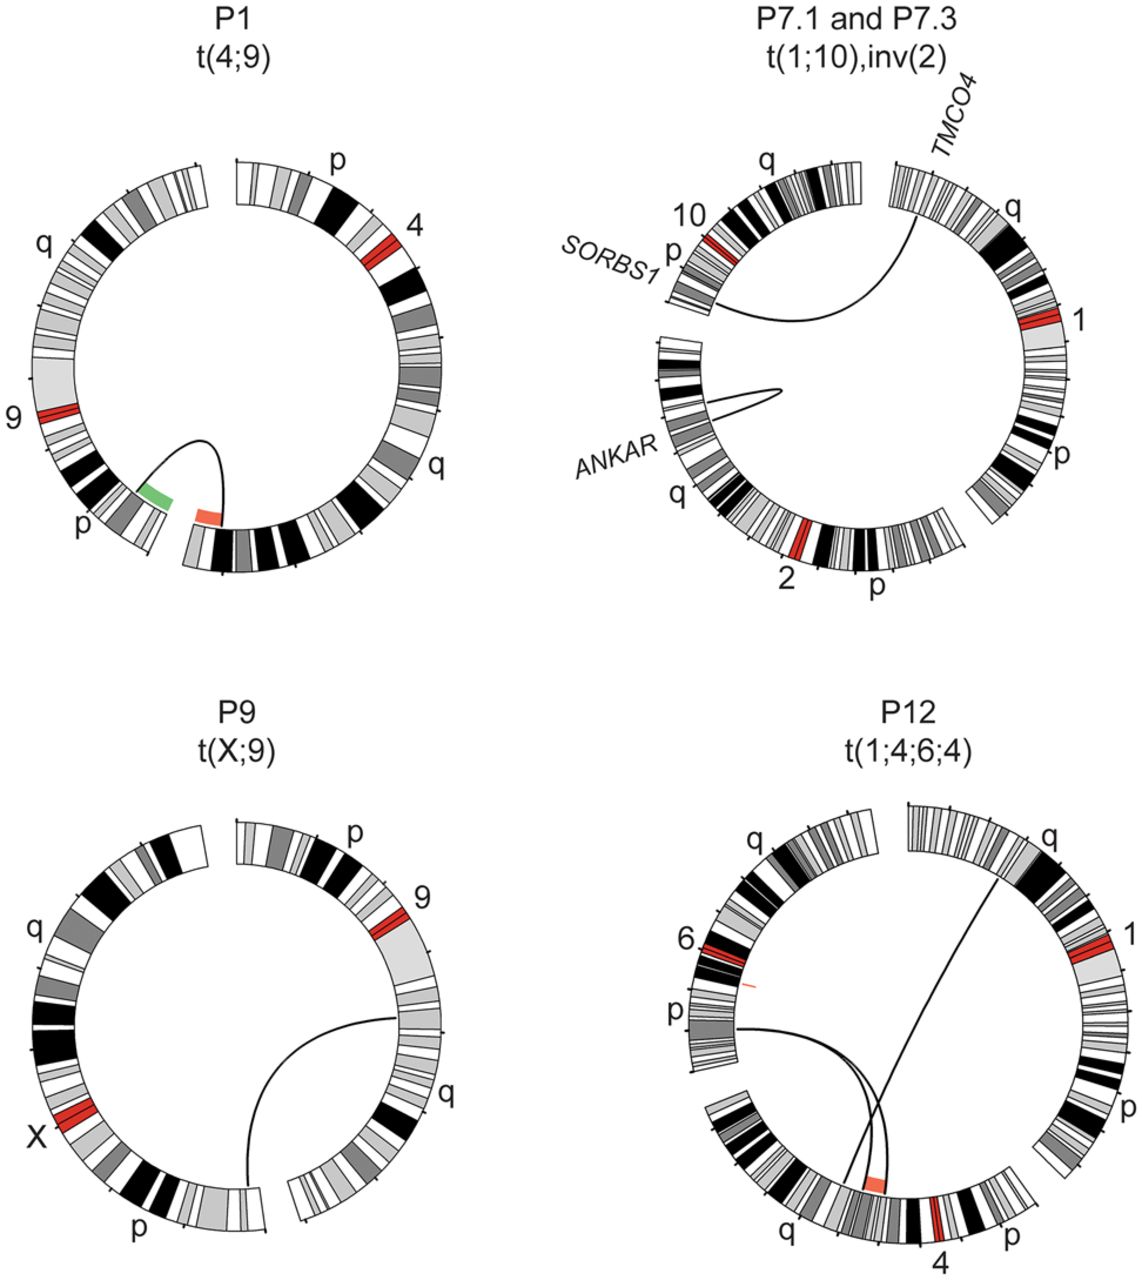
Figure 2.
Translocations and inversions identified with lrGS. Circos plots of rearrangements detected in four cases using lrGS: a t(4;9) in P1, a t(1;10) and inv(2) (P7.1 and P7.3), a t(X;9) (P9), and a t(1;4;6;4) (P12). A green/red line indicates copy number gain/loss, respectively. Genes disrupted are indicated at the breakpoint.


