
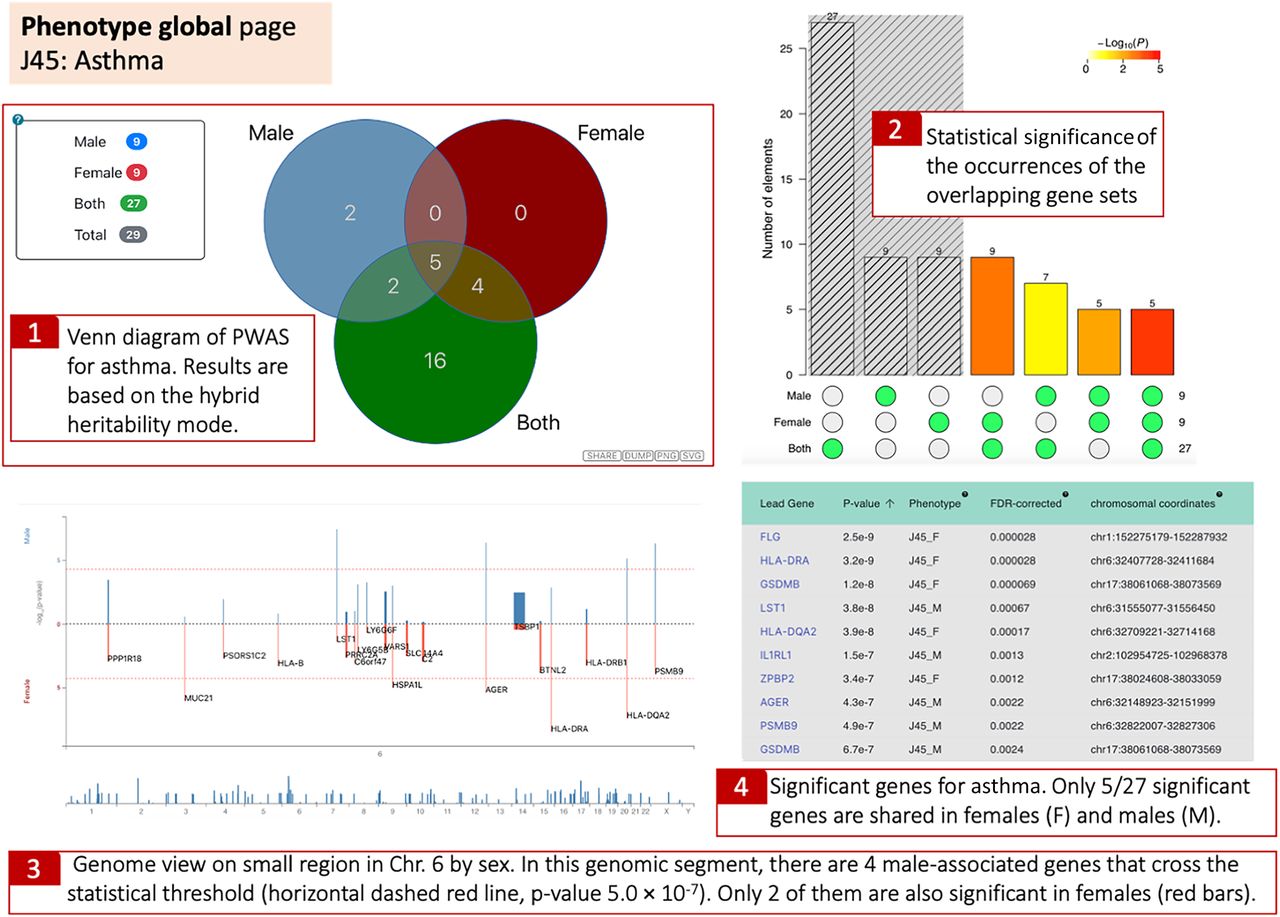
A collapsed view in the phenotype global page with a comparison of the genetic effects by sex. The Venn diagram shows the results for males, females, and both with the number of genes identified by PWAS Hub (1). A visual of a three-way Fisher's exact test is presented by the upset plot. The gray-shaded area is for the unions among the three subsets. The P-values are estimated to the P-value of having the exact subset of genes with respect to a random occurrence (2). Manhattan-like plot that maps the identified genes on the genome. The y-axis gives significance values for the enrichment for males (blue) and females (red). The x-axis depicts the chromosomal coordinates. A zoom-in option is implemented from a genomic overview. More information is available by popup options with hover over a gene name (3). A sortable summary table for each gene is shown for all genes according to their sex-stratified asthma (J45) (4).


