
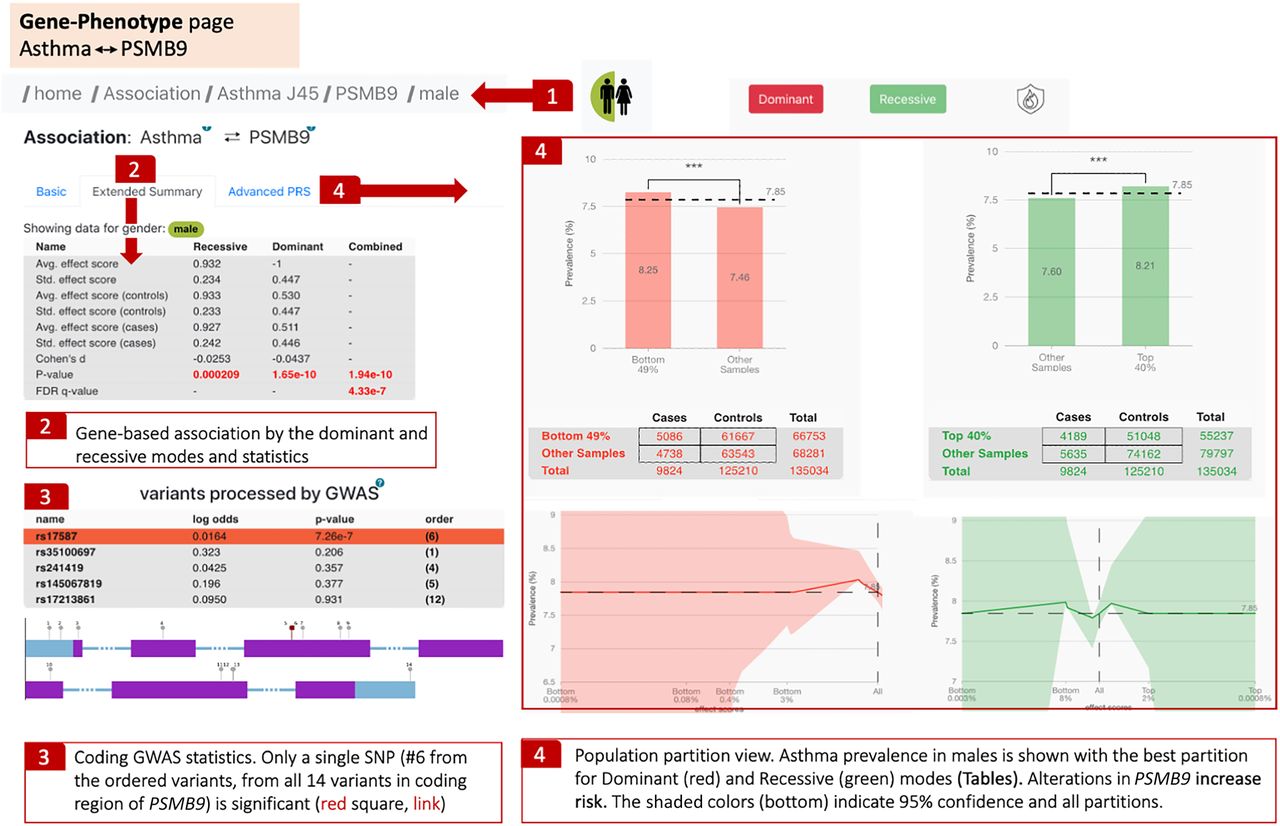
Figure 6.
Gene–phenotype analysis page. The breadcrumb tool indicates the analysis is male-specific for asthma (1). Extended statistical information is shared in a table with a calculated Q-value for the hybrid heritability mode (2). The results of cGWAS and the list of significant variants along the sequence. Each variant is labeled by its sequential number along with the coding exons. Significant variant (#6) for asthma is marked by a red square (3). The population partition view of dominant and recessive gene-population analysis is shown with 2 × 2 contingency tables used to determine Fisher's exact statistics (4).


