
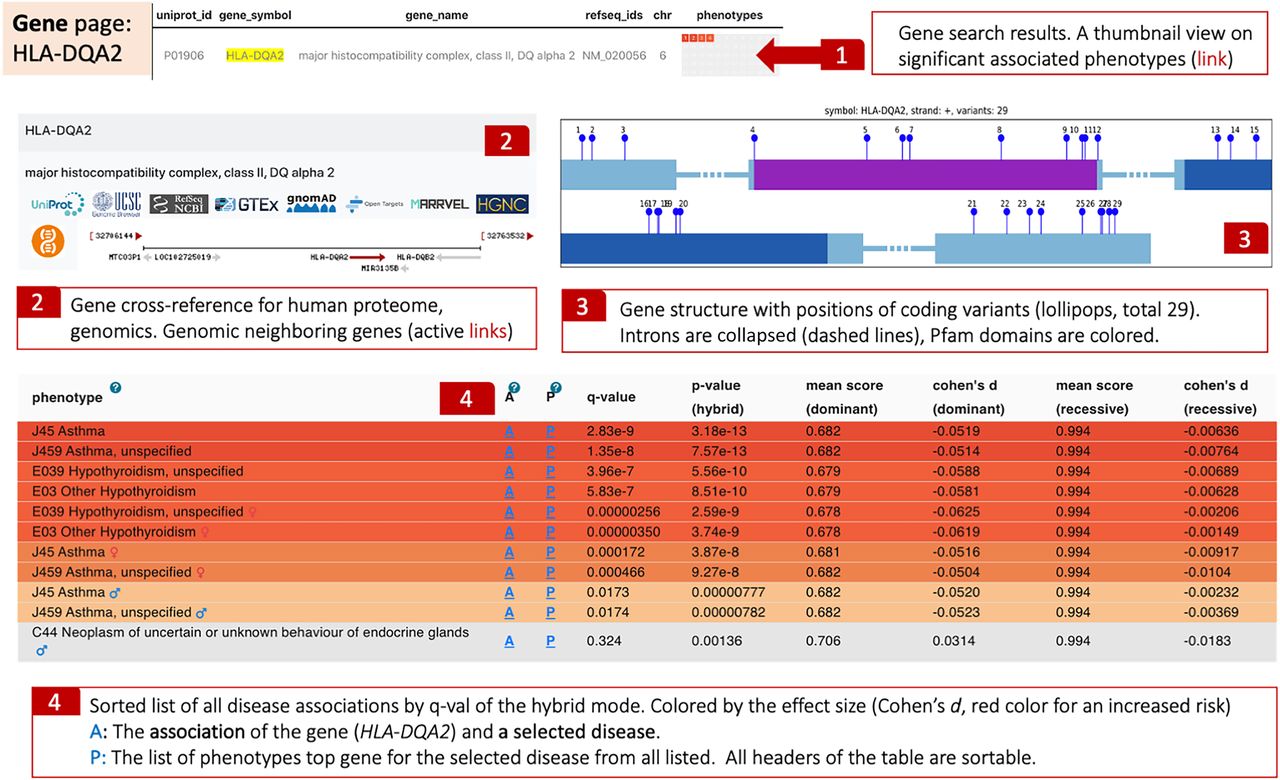
Figure 5.
Gene-centric page. The search for a gene provides its protein and RefSeq IDs and a thumbnail-colored view of the associated phenotypes. The red color depicts the effect size and directionality of an increased risk (1). Cross-references to major resources include an active map of the genomic location of the gene (2). The numbered lollipops represent the coding variants that are included in the PWAS analysis, numbered along the protein length (3). The table summarizes the statistics of this gene with all other phenotypes and diseases. The colors depict the strength of the effect size and its directionality versus multiple phenotypes (4).


