
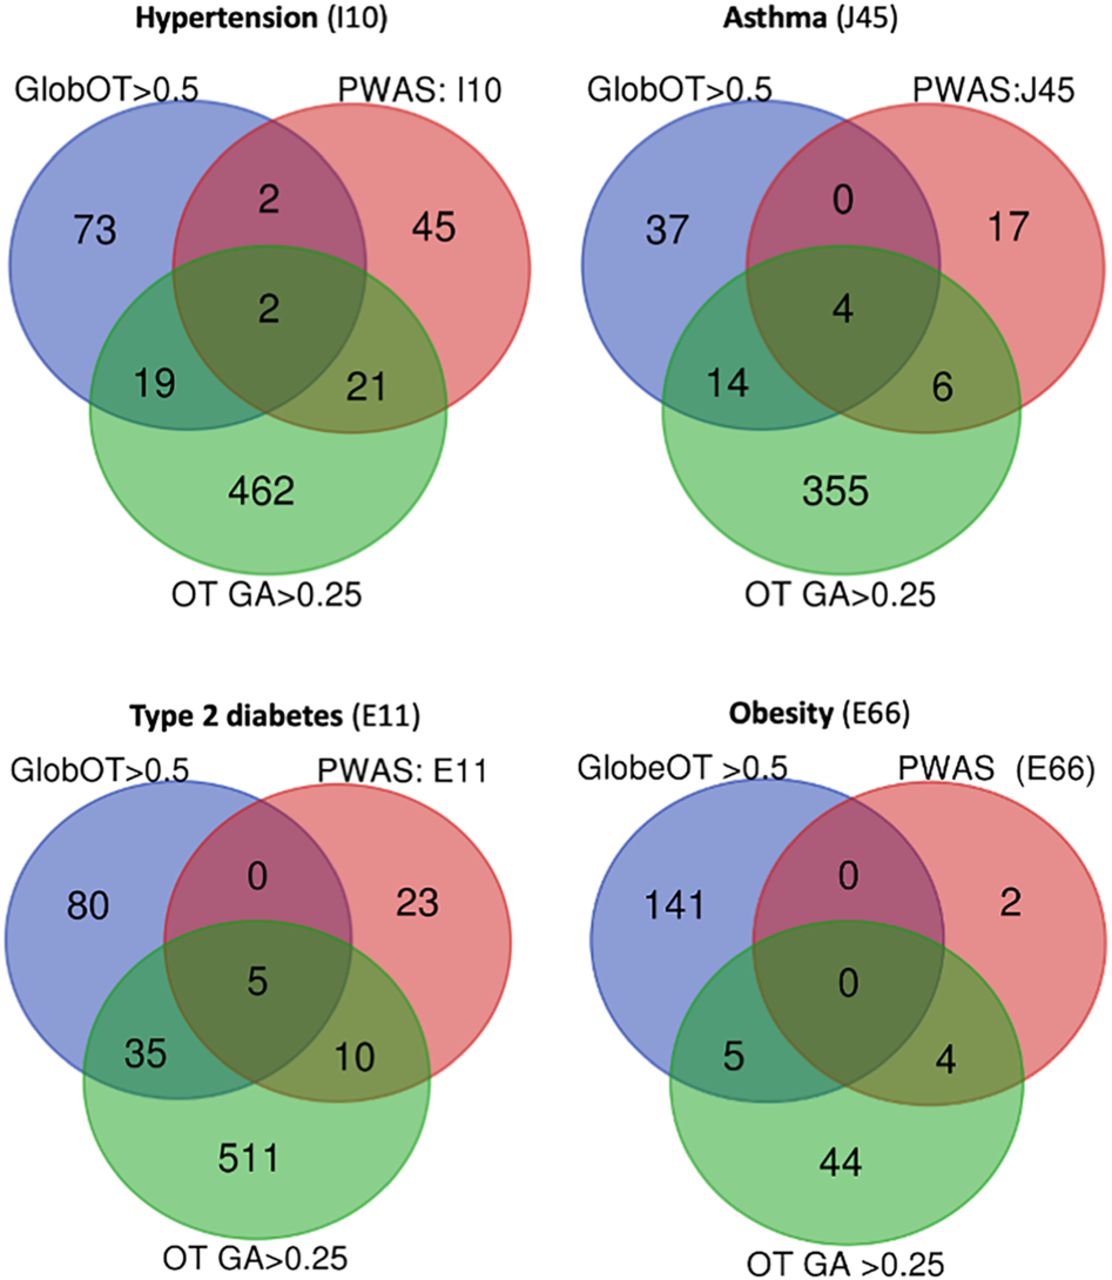
Figure 4.
Comparative results of PWAS and Open Targets (OT) for multiple phenotypes. The Venn diagram indicates the number of overlapping genes for PWAS-significant genes, for OT by the global score >0.5, and for the results of GWAS as compiled by OT with GA score > 0.25. The results shown are for ICD-10 of hypertension (I10), asthma (J45), type 2 diabetes (E11), and obesity (E66). The statistical significance of the level of overlap determined based on the hypergeometric distribution test calculation.


