
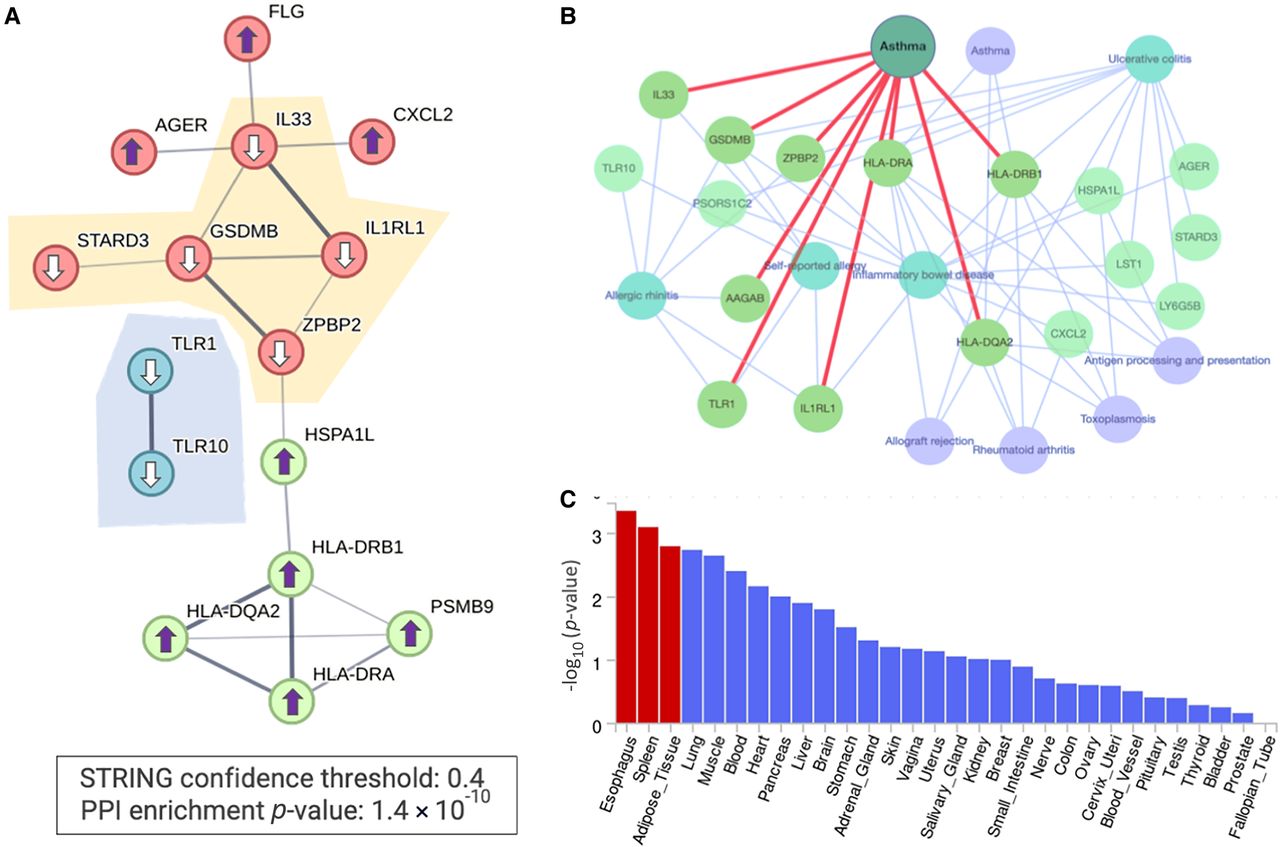
Functional enrichment of PWAS-associated genes of phenotype J45 (asthma). (A) STRING PPI network. The graph shows only significant connected genes (PPI confidence score >0.4, P-value for PPI network 1.4 × 10⁻¹⁰) along with their directionality (arrows up and down, depict increased and decreased risk, respectively). The subnetworks of genes that exert a decreased risk for asthma are highlighted. (B) A network view based on Enrichr-KB for the 27 PWAS-associated genes as input (Evangelista et al. 2023). The network consists of a knowledge graph based on the best match to the input gene list with the top findings from the GWAS catalog (light blue, underline) and from KEGG pathways (light purple). The red edges mark the associated genes identified by the GWAS catalog (2019) for asthma. (C) Statistical significance by tissue expression of the 27 identified PWAS-associated genes. The analysis combines all 27 differentially expressed genes (up- and downregulation) based on the GTEx database for 30 tissues as implemented in the FUMA platform (Watanabe et al. 2017). The significant tissues are colored red.


