
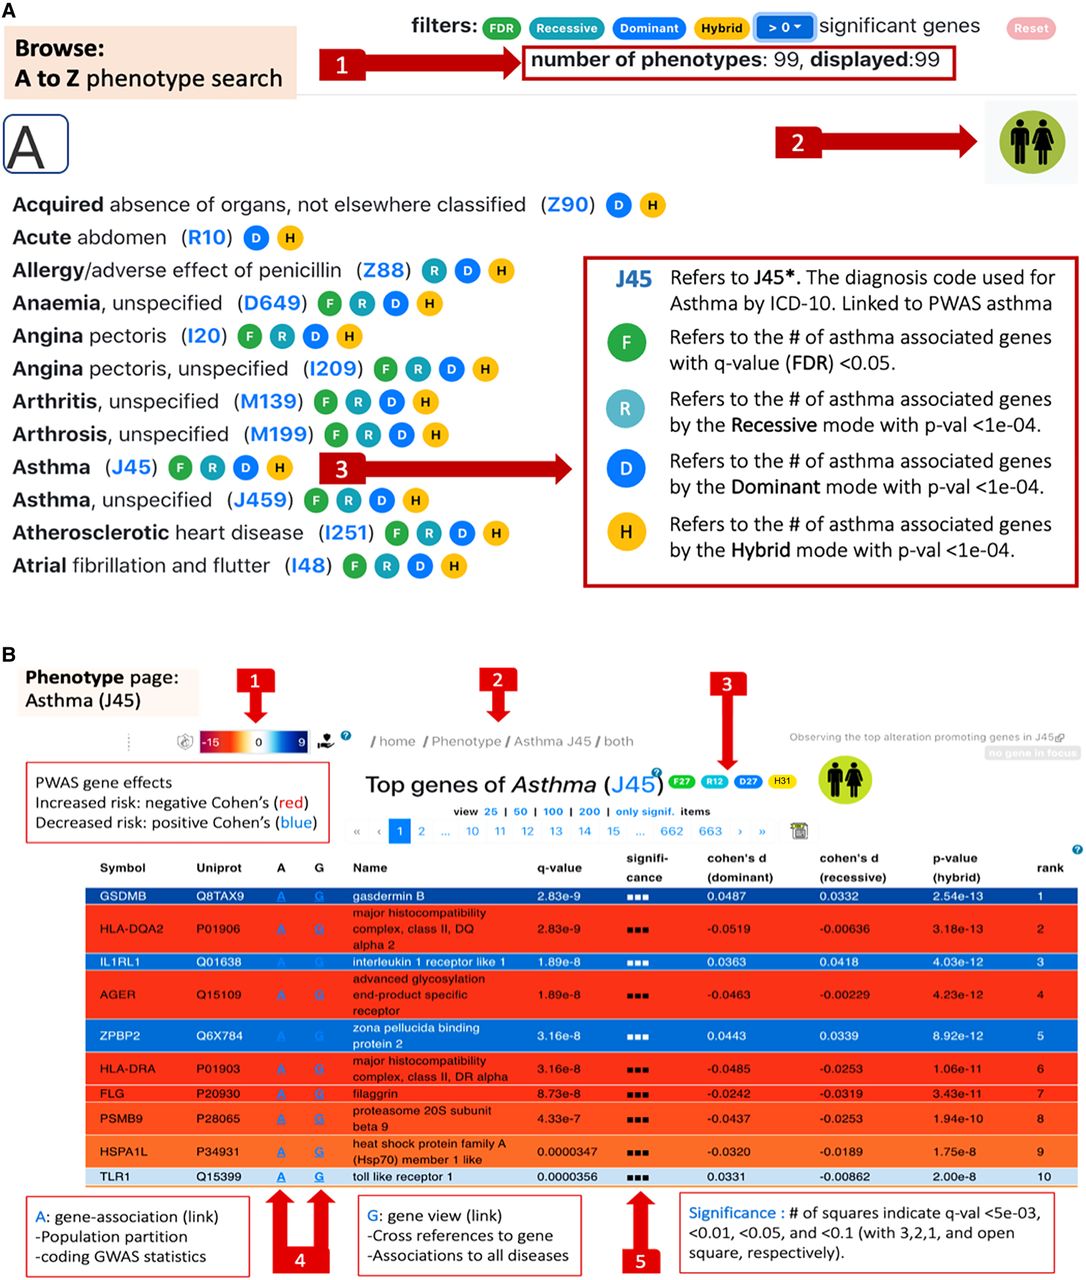
Search page and phenotype page. (A) Browsing the “Phenotypes A to Z” search page. The user can filter out phenotypes by selecting a threshold for the number of significant results. Once filtered, (1) reports the subset size. The user selects whether the browsing and downstream analyses are restricted to females, males, or both. In this example, a cohort with both sexes was selected (2). Each phenotype is indicated by its ICD-10 code (clickable links to Phenotype pages). Results that meet the preselected criteria are marked by the symbols abbreviated F, R, D, and H (3). (B) The phenotype page for J45 (asthma). The effect sizes of the genes are color-coded from red (negative Cohen's d values = increased risk) to blue (positive Cohen's d values = decreased risk) (1). The intensity of the colors marks the statistical significance (Q-value). Breadcrumb navigation links are available on all pages (2). Summary statistics of the number of results according to the F, D, R, and H definitions, with an active link to the selected cohort. The link that marks J45 points the user to the “Phenotype global page” (3). Navigation to either the “Gene page” (G) or the “Gene-Association page” (A) (4). The significance of the listed genes is marked by a predetermined Q-value symbolic scale (5).


