
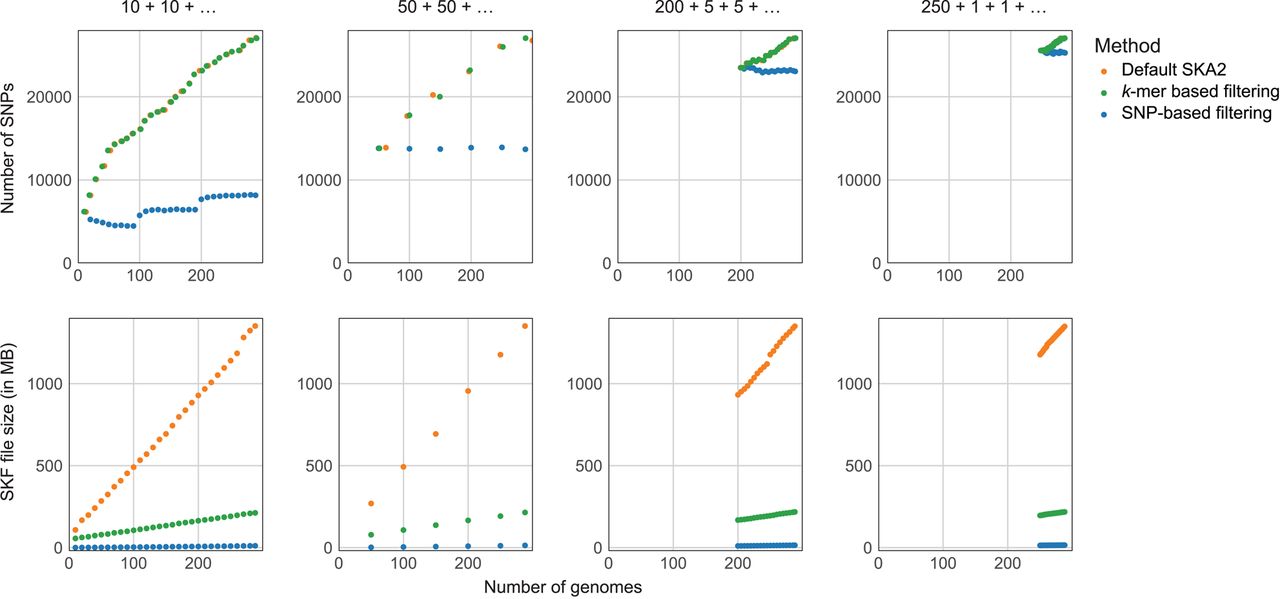
Figure 5.
Online analyses of E.coli genomes. The three different genome addition strategies mentioned in the main text are displayed from left to right. Units of the x-axes (number of genomes) are identical across the six plots, and units of the y-axes (number of SNPs and SKF sizes) are identical within plots on the same line. “k-mer-based filtering” refers to the filtering based on missing split-k-mers, and “SNP-based filtering” refers to the filtering based on presence-absence of SNPs. Points corresponding to the number of SNPs (upper panels) obtained from default SKA2 analyses and after k-mer-based filtering were jittered to avoid overlapping.


