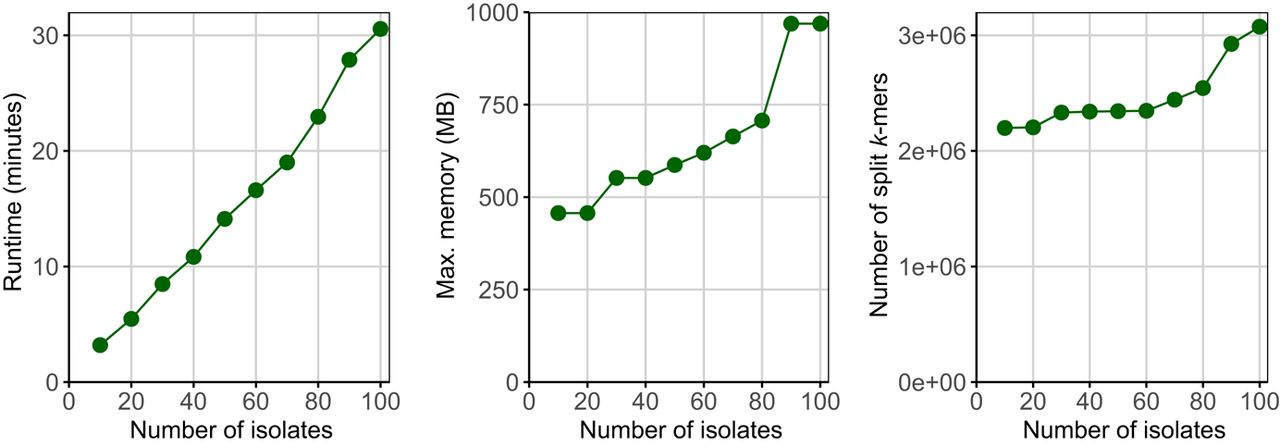
Seamless, rapid, and accurate analyses of outbreak genomic data using split k-mer analysis

(Downloading may take up to 30 seconds. If the slide opens in your browser, select File -> Save As to save it.)

Click on image to view larger version.

Figure 4.
Figure 4.

Empirical scaling of SKA2 computational efficiency using increasing block sizes from 100 isolates of the S. pneumoniae IC1 cluster. The numbers of split k-mers represent the total numbers of split k-mers contained across all samples.

This Article

  1. Genome Res. 34: 1661-1673

Preprint Server