
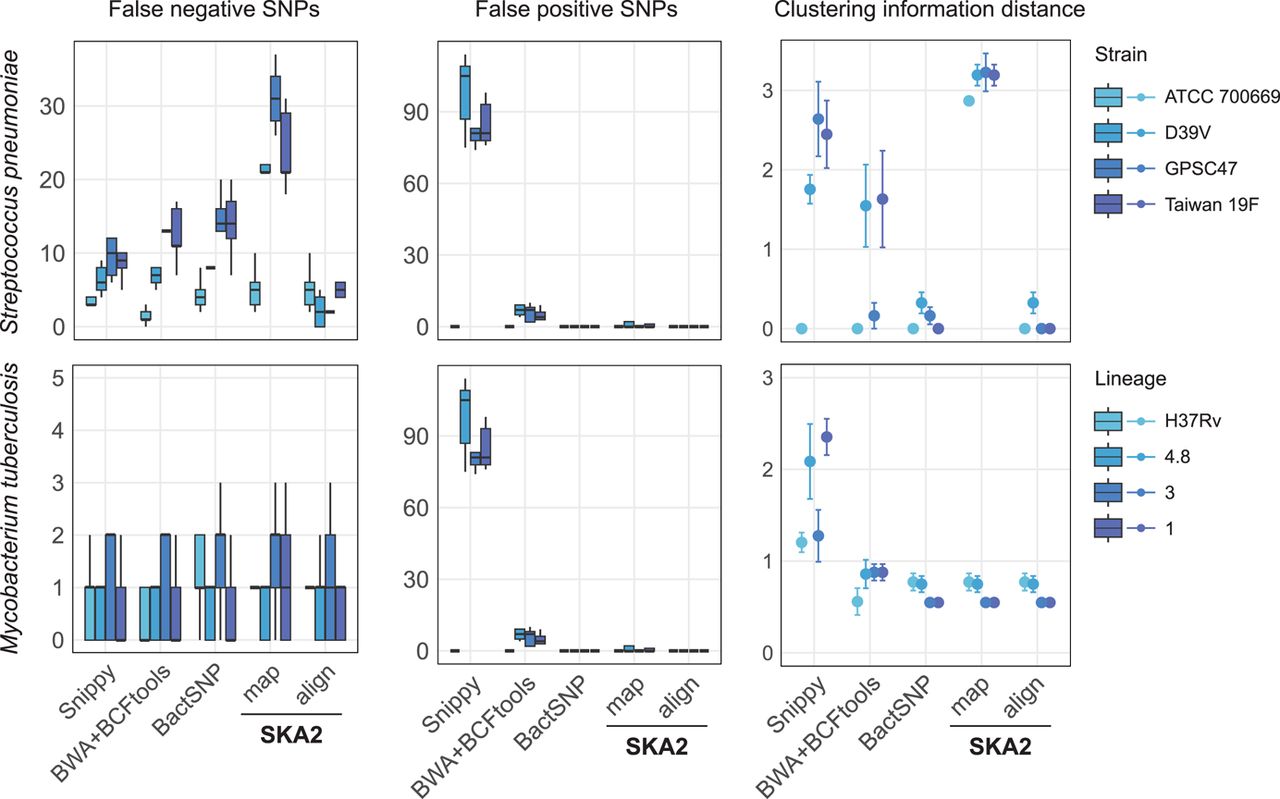
Results obtained from the analyses of simulated outbreaks showing recall (false negatives), false positives, and clustering information distance from the four different tools. “map” and “align” refer to the SKA2 functions used to generate SNP alignments. References of increasing distance (darker blue) from the source of the outbreak were used to evaluate reference bias. The error bars in the CI distance plots correspond to the 95% confidence interval calculated from 10 values (two phylogenies were obtained from each SNP alignment using two independent maximum-likelihood runs). The numbers 4.8, 3, and 1 in the legend correspond to the names of M. tuberculosis lineages.


