
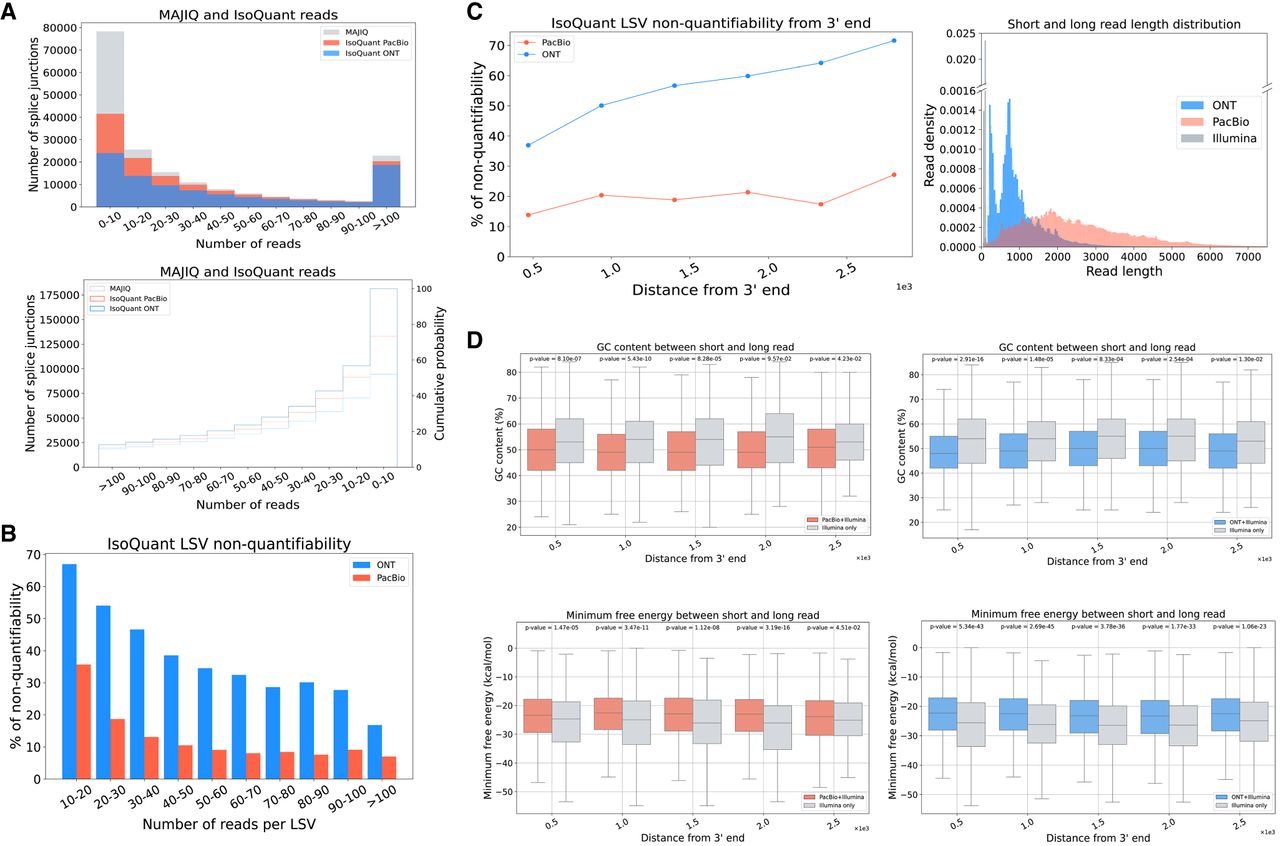
Analysis of sources of discrepancy between short- and long-read-based transcriptome variations. (A) The number of MAJIQ's splice junctions (gray) identified by IsoQuant using PacBio (red) or ONT (blue) as a function of the number of short reads covering the junctions. The histogram on the top and CDF on the bottom show the number of splice junctions (y-axis) as a function of read number (x-axis). (B) Bar plots showing the fraction of LSV reported by MAJIQ's short-read analysis, which were “nonquantifiable” by IsoQuant using PacBio-matched (orange) and ONT-matched (light blue) long-read data. Here a “quantifiable” LSV require at least 10 reads covering its respective junctions. Of note, a substantial fraction of LSV remain unquantifiable by long reads even for those with extremely high short-read coverage (more than 100 reads). (C) Same plot as in B for the fraction of nonquantifiable LSVs by long-read data, but here as a function of distance from transcript 3′ end. When LSV involved transcripts with multiple 3′ ends, the shortest distance was used as a conservative estimate. The length distribution of short and long reads in the LRGASP data set was used in all the above subfigures. (D) Boxplots showing GC content and minimum free energy (MFE) across various distances from the transcript 3′-end for junctions with more than 40 Illumina reads in A that are only detected by short reads (gray) or are also detected by long reads (red, PacBio; blue, ONT). Each boxplot represents the GC content and MFE (y-axis) as a function of the distance from 3′-end (x-axis). The median is denoted by the horizontal line in each box, the upper and lower quartiles are denoted by the box, and the whiskers show points that lie within 1.5 IQRs of the lower and upper quartiles. P-values were calculated using the Mann–Whitney U-test. Note that A–D are averaged across the three LRGASP data replicates.


