
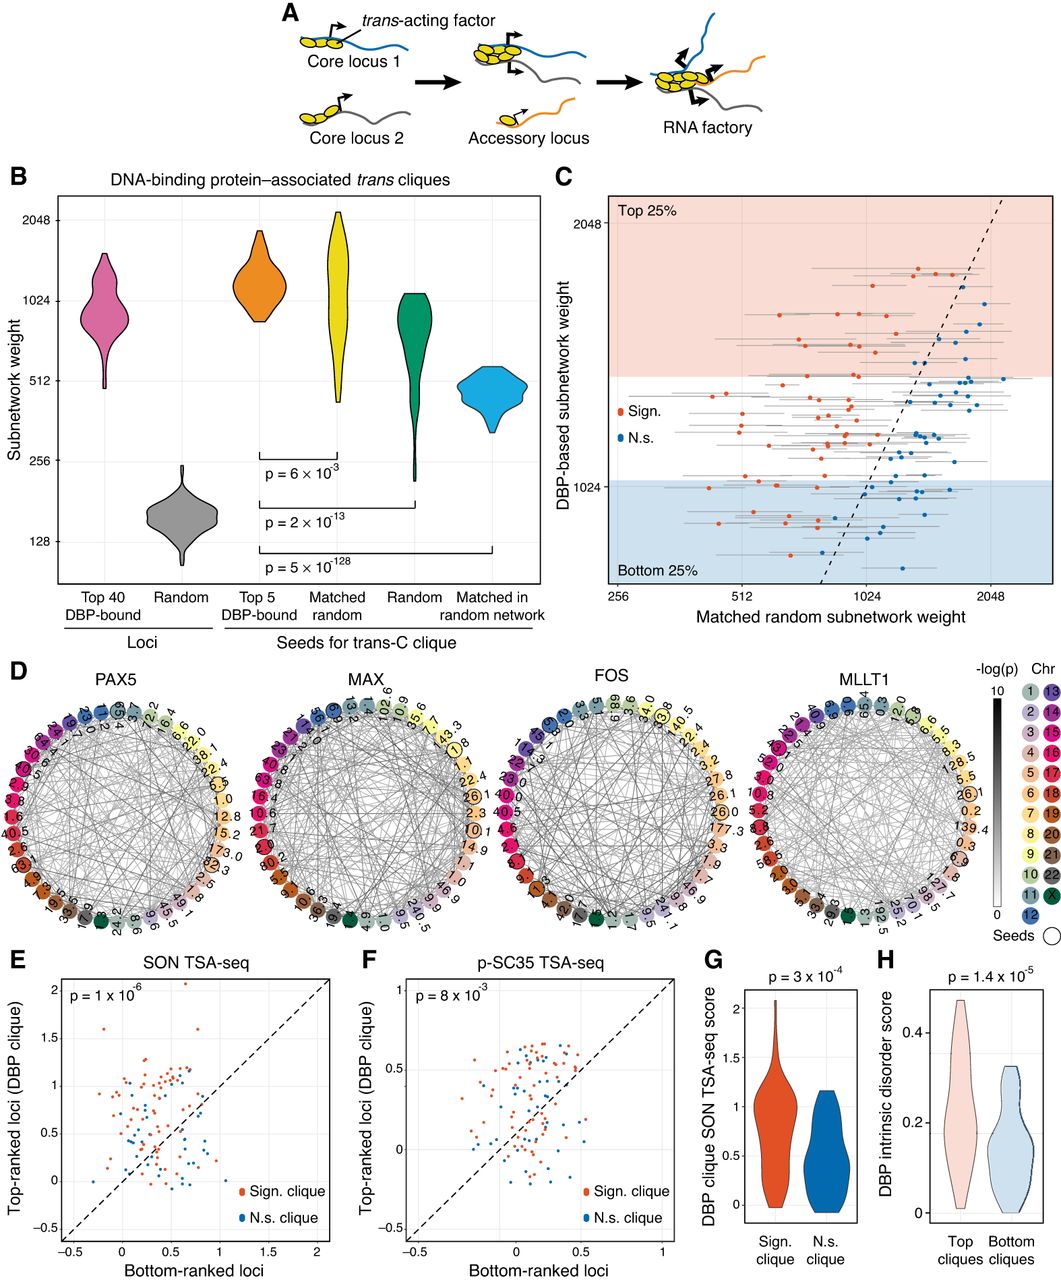
Trans-C identifies DNA-binding protein–associated trans cliques proximal to nuclear speckles. (A) Schematic of the mechanistic hypothesis for the formation of specialized RNA factories involving trans-interacting chromatin domains. Multiple copies of trans-acting regulatory factors (i.e., transcription or splicing factors) bind to core nucleic acids, aggregate to form new clusters and/or enrich pre-existing ones, and recruit accessory coregulated nucleic acids. RNA factories promote the efficacy and accuracy of RNA biogenesis processes (thicker black arrows). (B) Trans-C-identified subnetworks in lymphoblastoid cells built from loci characterized by strong binding of 110 DBPs have dense contacts. We plot the distribution of subnetwork weights for six types of sets of 40 loci: (1) loci with the highest number of ChIP-seq peaks for a given DBP (pink), (2) randomly drawn loci (gray), (3) top loci ranked by trans-C from a seed of five loci with the highest number of ChIP-seq peaks for a given DBP (orange), (4) top loci ranked by trans-C from a random seed of five loci whose starting subnetwork weight was matched to the seed of group 3 (yellow), (5) top loci ranked by trans-C from a seed of five randomly drawn loci (green), and (6) top loci ranked as for group 4 but starting from an interaction matrix that has been randomly shuffled (light blue). On average, sets seeded from loci most strongly bound by DBPs interact more strongly in trans than any of the other five types of sets of loci, including the stringent “matched random” control (P-values by Mann–Whitney U test). (C) For each DBP analyzed in B, we compare the weights of subnetworks obtained with trans-C from “top five DBP-bound” seeds (single data point) and “matched random” seeds (average of 1000 subnetworks ± SD). In red are comparisons with significantly different weights (P < 0.05 after FDR correction). Shaded areas highlight the top and bottom quartile of DBP-based subnetwork weights. (D) Visualization of selected significant DBP-associated trans cliques in lymphoblastoid cells, plotted as described for Figure 2D (PAX5 and MAX, strongest cliques; FOS and MLLT1, highest fold change of clique strength over average strength of cliques in the matched random null model). (E,F) Proximity to nuclear speckles of loci within trans-C-identified cliques, measured as the average SON and p-SC35 TSA-seq signal for the corresponding genomic regions. For each subnetwork, the signal is compared with that of an equal number of loci at the opposite end of the trans-C ranking. DBP-based cliques are overall significantly more proximal to both SON and p-SC35 than matched control sets (P-values by Mann–Whitney U test). Cliques that are significantly stronger compared with the null model in the analysis from panel C (Sign.) are in red, and nonsignificant ones (N.s.) are in blue. (G) The proximity to SON for significant versus nonsignificant cliques from panel C is significantly different by Mann–Whitney U test. (H) The strongest DBP-based subnetworks correspond to DBPs with a higher intrinsically disordered protein (IDP) score. We plot the IDP scores for DBPs resulting in the bottom and top quartiles of DBP-based subnetworks from panel C. The difference is statistically significant by Mann–Whitney U test.


