
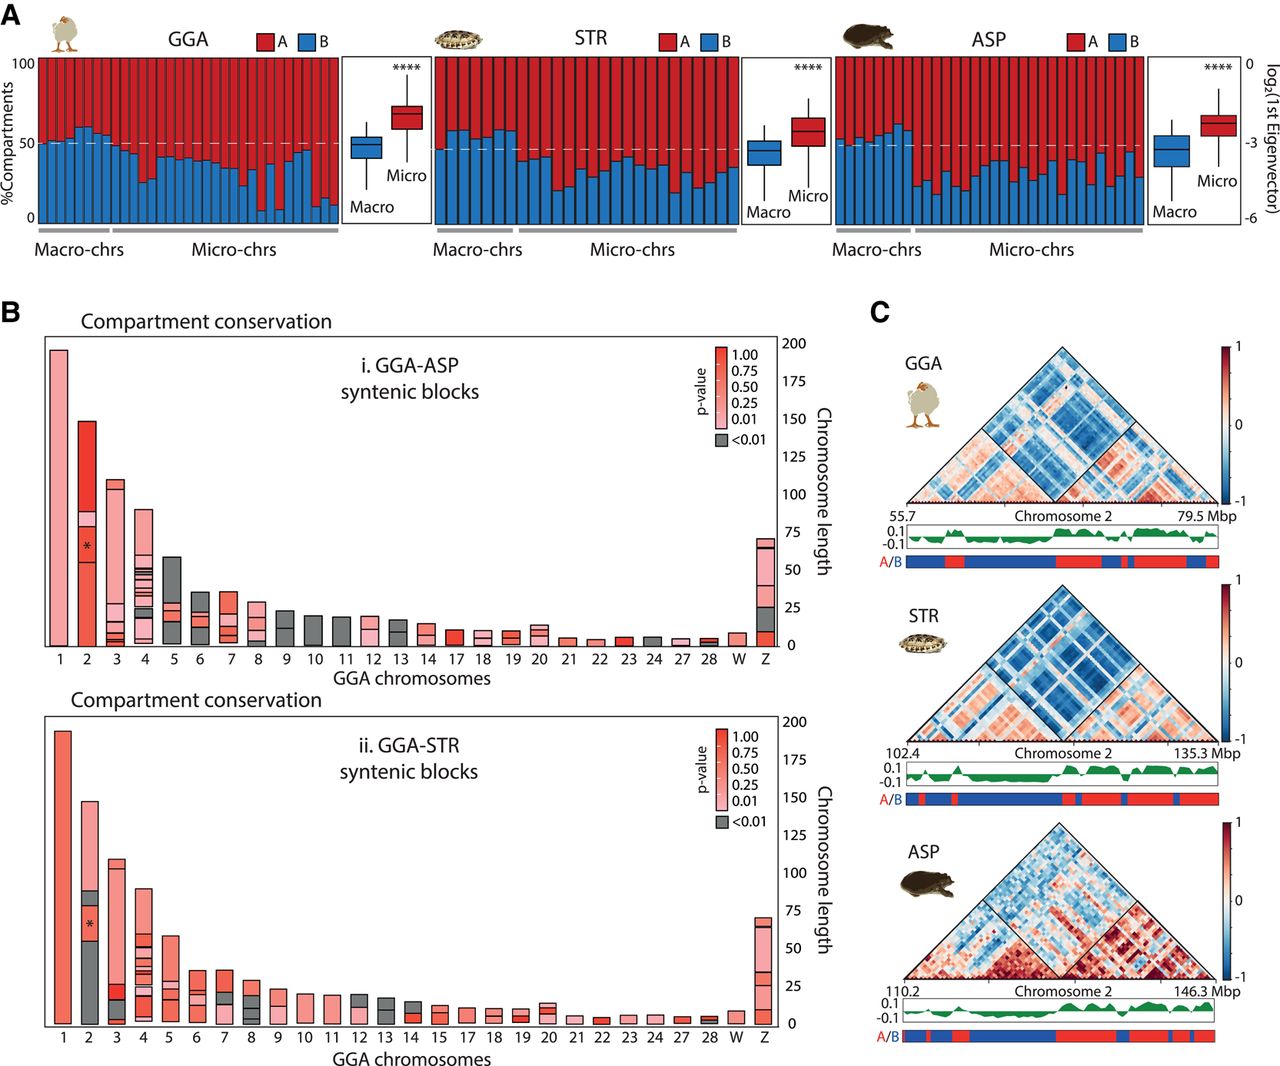
Genome compartmentalization in chicken and turtles. (A) Bar plots depicting the percentage of each chromosome assessed to be an A (red) or B (blue) compartment, distinguishing between macro and microchromosomes. A two-tailed t-test between macro and microchromosomes is also illustrated for each species; (****) P < 0.001 in all cases. (B) Chicken (Gallus gallus [GGA]) chromosome ideograms color-coded according to the compartment conservation of homologous syntenic blocks between GGA and Apalone spinifera (ASP) (upper panel), and between GGA and Staurotypus triporcatus (STR) (lower panel), expressed as P-value scores (statistically significant P-values are denoted in gray). Asterisks in Chromosome 2 indicate an exemplar syntenic region illustrated in detail in (C). (C) Enlargement of a structural conserved syntenic region between GGA, STR, and ASP Chromosome 2. Compartment conservation is represented by the compartments heatmap and the distribution of values of its first eigenvector, whereas TAD conservation is represented by the contact heatmaps and triangles delineated by black lines. Genome-wide TADs and A/B compartments are presented in Supplemental Figure S4.


