
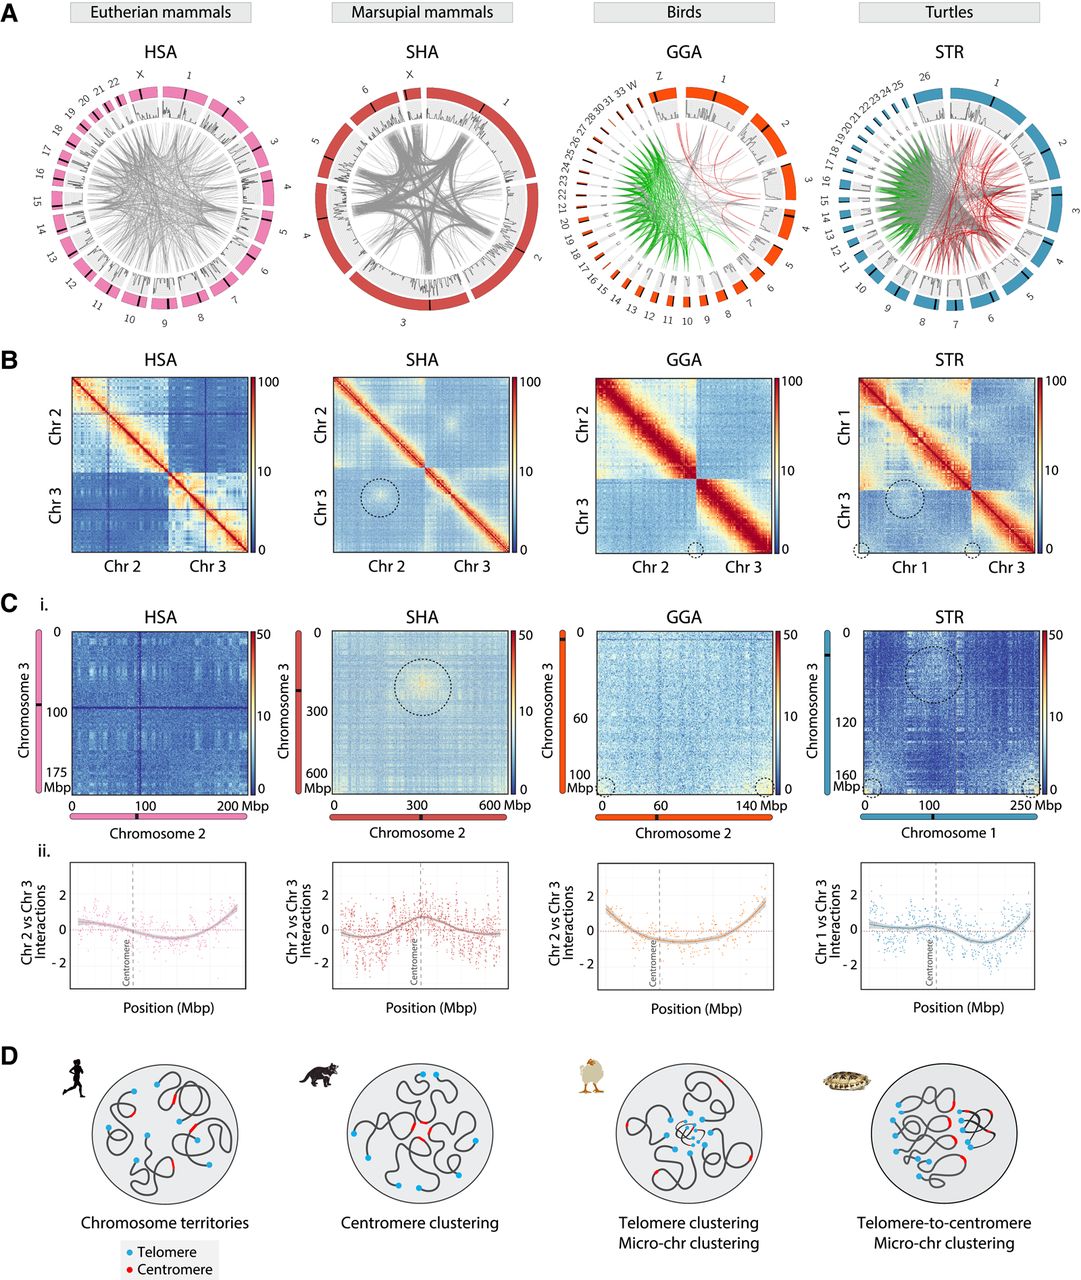
Divergent patterns of nuclear architecture. (A) Circos diagrams depicting interchromosomal interactions in human (Homo sapiens [HSA], Rao et al. 2014), Tasmanian Devil (Sarcophilus harrisii [SHA], Álvarez-González et al. 2022a), chicken (Gallus gallus [GGA], Fishman et al. 2019), and Northern Giant Musk Turtle (Staurotypus triporcatus [STR], this study). In each plot, the chromosomes are illustrated in the outer colored track, whereas the inner gray track illustrates the histogram of the absolute value of the interaction at each genomic position. The color of the links at the center of each Circos plot indicates different types of interactions: full set of interactions (gray links), interactions among macrochromosomes (red links), and interactions among microchromosome (green links). (B) Hi-C contact maps representing a pair of macrochromosomes for human (HSA, Rao et al. 2014), Tasmanian Devil (SHA, Álvarez-González et al. 2022a), chicken (GGA, Fishman et al. 2019), and Northern Giant Musk Turtle (STR, this study). Note the centromeric interactions in the Tasmanian Devil, the telomeric interactions in the chicken, and the telomeric–centromeric interactions in the turtle highlighted by dashed-line circles. (Ci) Heatmaps showing normalized interchromosomal interactions between heterologous chromosomes in human (Chromosomes 2 and 3), Tasmanian Devil (Chromosomes 2 and 3), chicken (Chromosomes 2 and 3), and Northern Giant Musk Turtle (Chromosomes 1 and 2). Telomeric, centromeric, and telomeric–centromeric interactions are highlighted by dashed-line circles. The position of centromeres is denoted by black lines for each chromosome. (Cii) Z-score interactions as a function of genomic distance for representative chromosomes of human, Tasmanian Devil, chicken, and musk turtle. Dashed horizontal lines denote the centromere location. (D) Representation of chromosome position inside nuclei of species showing chromosomal territories (CTs) without centromere clustering (human), centromere clustering (Tasmanian Devil), telomere clustering (chicken and musk turtle), and telomere–centromere associations (musk turtle). Centromeres are depicted in red and telomeres in blue.


