
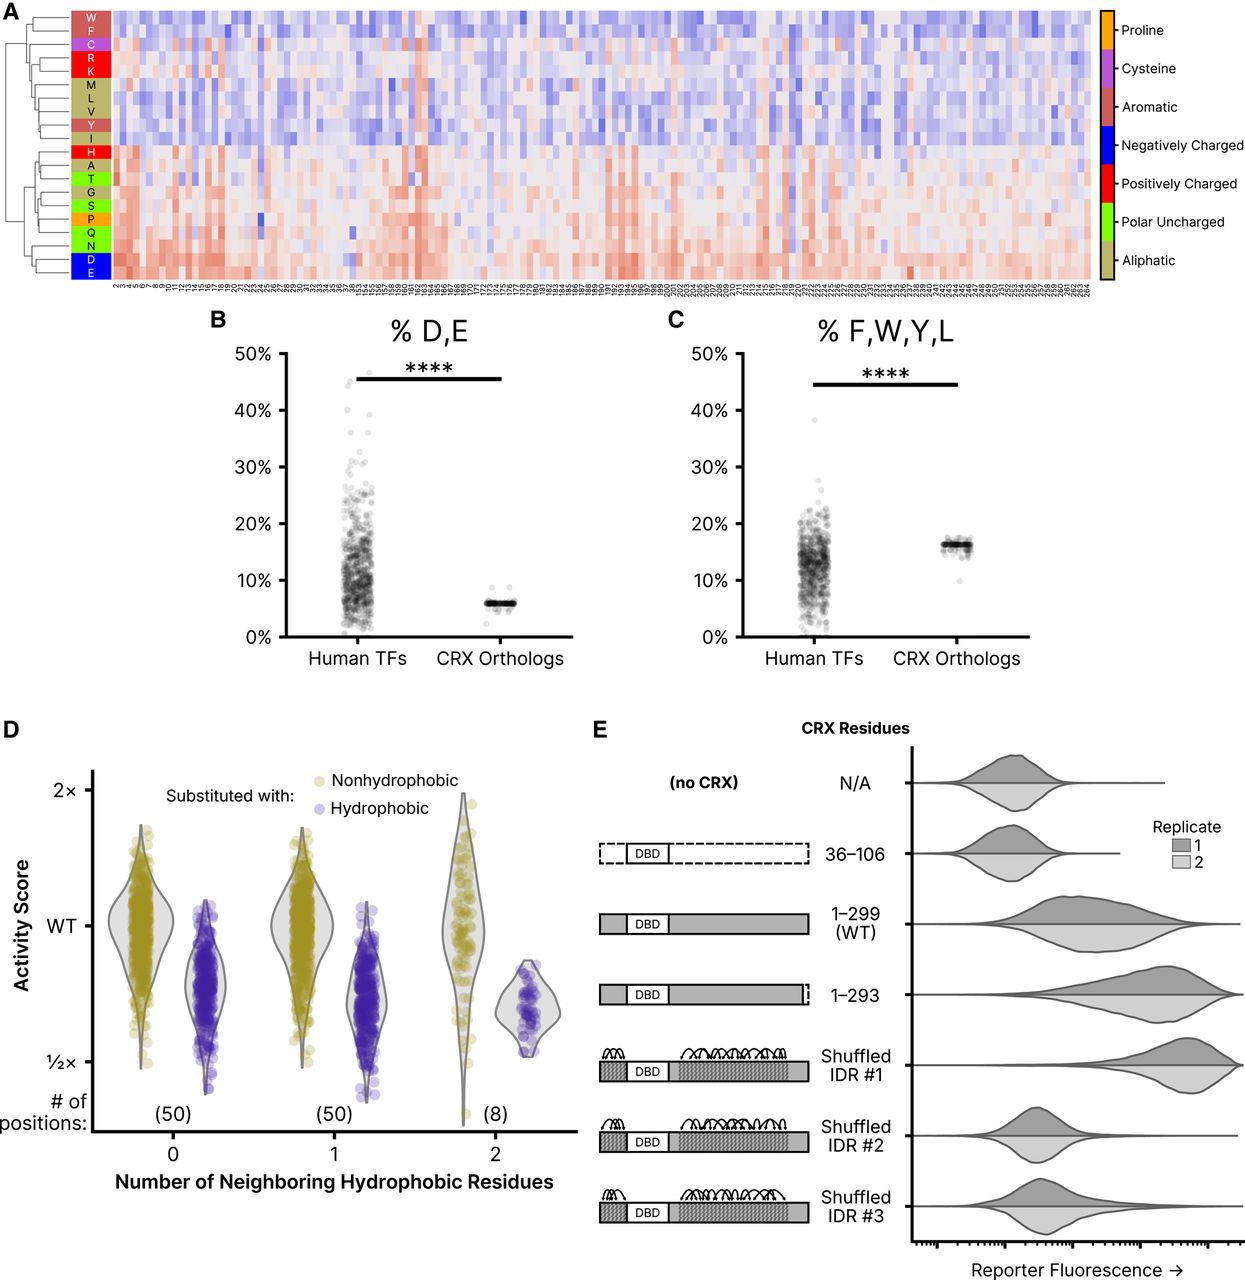
Residue class preferences in the CRX transcriptional effector domain. (A) Unsupervised hierarchical clustering (UPGMA method) of per-position activity scores for residues in the disordered region of the transcriptional effector domain (residues 2–38 and 153–264). Residues colored by class. Substitution activity scores are colored as in Figure 2. (B) Abundance of aspartic acid (D) and glutamic acid (E) residues in disordered regions of all human TFs and CRX orthologs. (C) The abundance of phenylalanine (F), tryptophan (W), tyrosine (Y), and leucine (L) residues in disordered regions of all human TFs and CRX orthologs. For (B) and (C), significance was tested by a two-sided Mann–Whitney U test; P < 1 × 10−39. (D) Comparison of the effects of substituting nonhydrophobic positions in wild-type CRX with hydrophobic (F, W, Y, M, I, L, or V) or nonhydrophobic amino acids, separated by the number of neighboring hydrophobic residues. The analysis is limited to positions in the disordered transcriptional effector domain; the number of positions in each neighbor group is shown in parentheses. (E) Reporter activation (green fluorescence; arbitrary units) was measured in Reporter + LP cells with the indicated CRX variants integrated. Two independent biological replicate experiments per sample (distributions plotted from 50,000 cells).


