
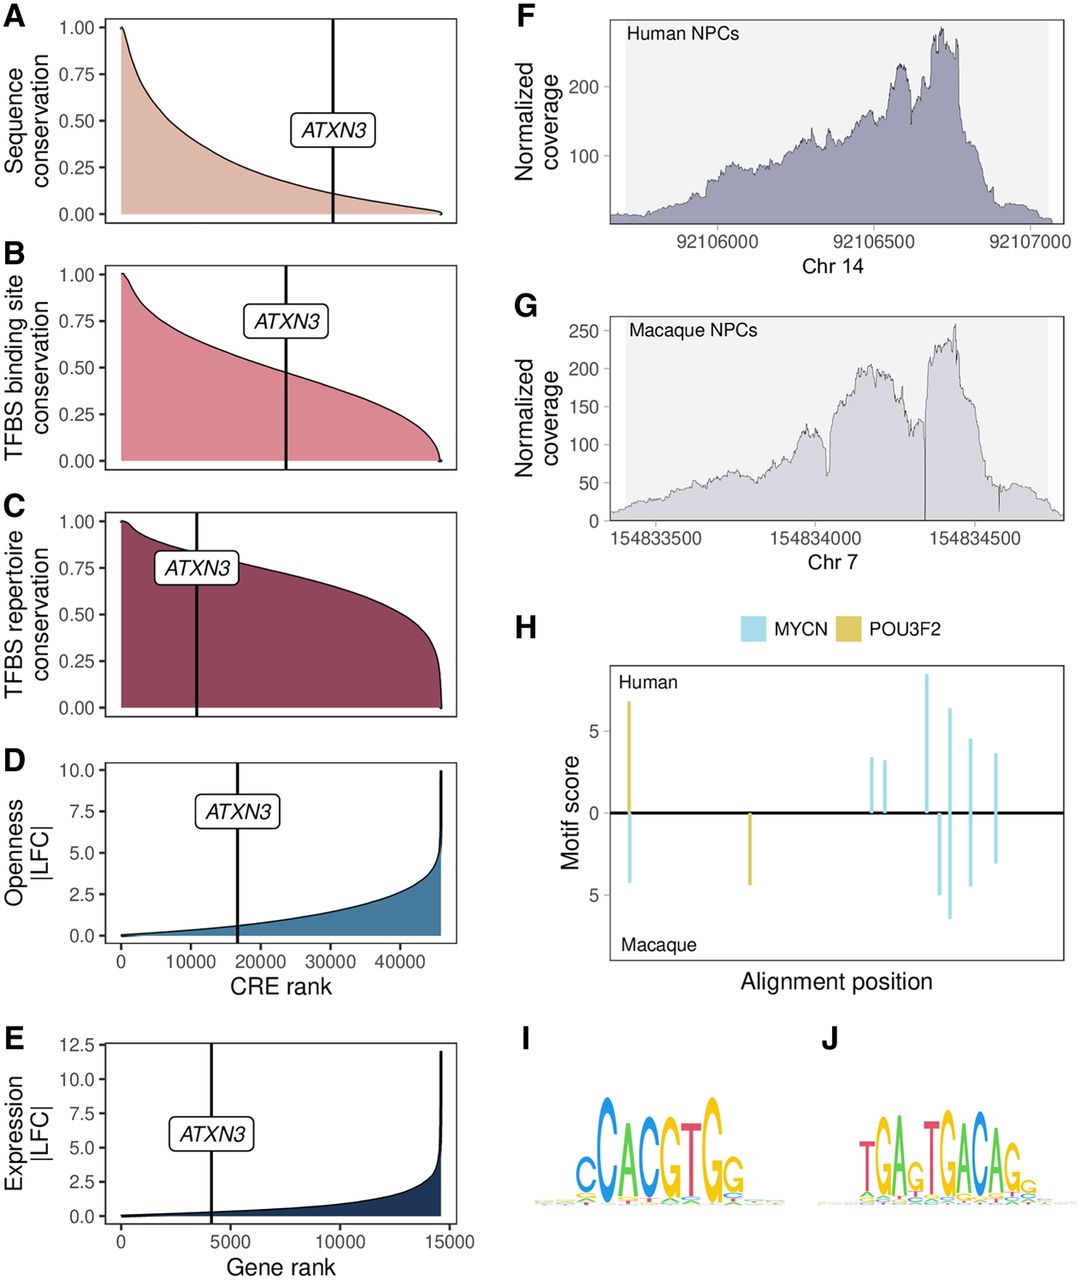
Ranks of ATXN3 PD9 promoter compared with other CREs in terms of the following: (A) sequence conservation (mean phastCons), (B) TFBS binding site conservation, (C) TFBS repertoire conservation, (D) CRE openness conservation between human and cynomolgus macaque in NPCs, and (E) ATXN3 gene expression conservation between human and cynomolgus macaque in NPCs. (F) ATXN3 PD9 promoter ATAC-seq read coverage in human NPCs. (G) ATXN3 PD9 promoter ATAC-seq read coverage in macaque NPCs. (F,G) ATXN3 PD9 promoter is accessible in NPCs from both species. Gray background area indicates the positions of the called ATAC-seq peak in the respective species. (H) ATXN3 promoter shows diverged TFBS positions between species among two TFs (MYCN, POU3F2) with validated binding based on ChIP-seq neural cell data that are involved in neurogenesis. Motif binding sites and scores are depicted in the aligned sequence space: human at the top and cynomolgus macaque at the bottom. (I,J) PWM logos from JASPAR2020 vertebrate core set of the investigated TF motifs with ChIP-seq data available: MYCN (I) and POU3F2 (J).


