
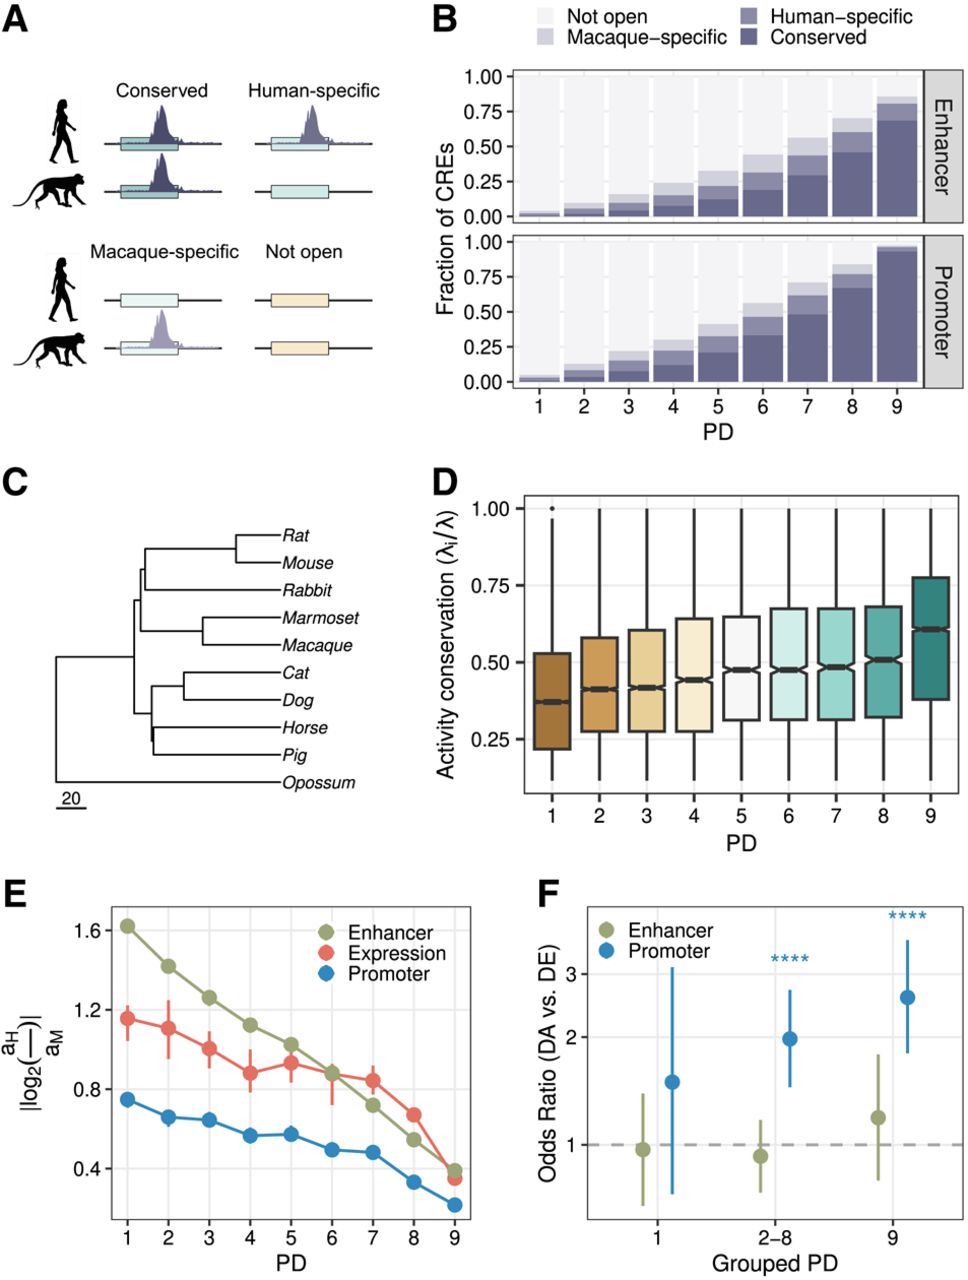
PD and evolutionary conservation of expression and regulatory activity. (A,B) The fraction of enhancers and promoters of different PDs as defined using data from nine tissues from the Epigenomics Roadmap Project, which overlapped with ATAC-seq peaks called in neural progenitor cell lines (NPCs) from cynomolgus macaques and humans. The colors indicate whether a human DHS-derived CRE overlapped with an NPC ATAC-seq peak from humans, cynomolgus macaques, both, or none. (C) The phylogeny from Bininda-Emonds et al. (2007) of species for which Roller et al. (2021) provided activity estimates for four tissues based on histone marks. Scale, million years ago. (D) Activity conservation for orthologous CREs based on Roller et al. (2021) (n = 47,377). We calculate the ratio subtree length λS for species in which the CRE is active over the total tree length λT. (E) Mean absolute log2-fold changes of gene expression and activities between humans and cynomolgus macaques. Error bars, 95% bootstrap CIs. PD9 genes (CREs) show more conserved expression (activity) than do more tissue-specific genes (CREs). (F) Enrichment (odds ratio > 1) of differentially accessible CREs with differentially expressed genes between humans and cynomolgus macaques using matched regulatory landscapes (n = 6882). Error bars, 95% CIs of the odds ratio. Asterisks indicate BH-adjusted Fisher's test P-value: (*) <0.05, (**) <0.01, and (***) <0.001.


