
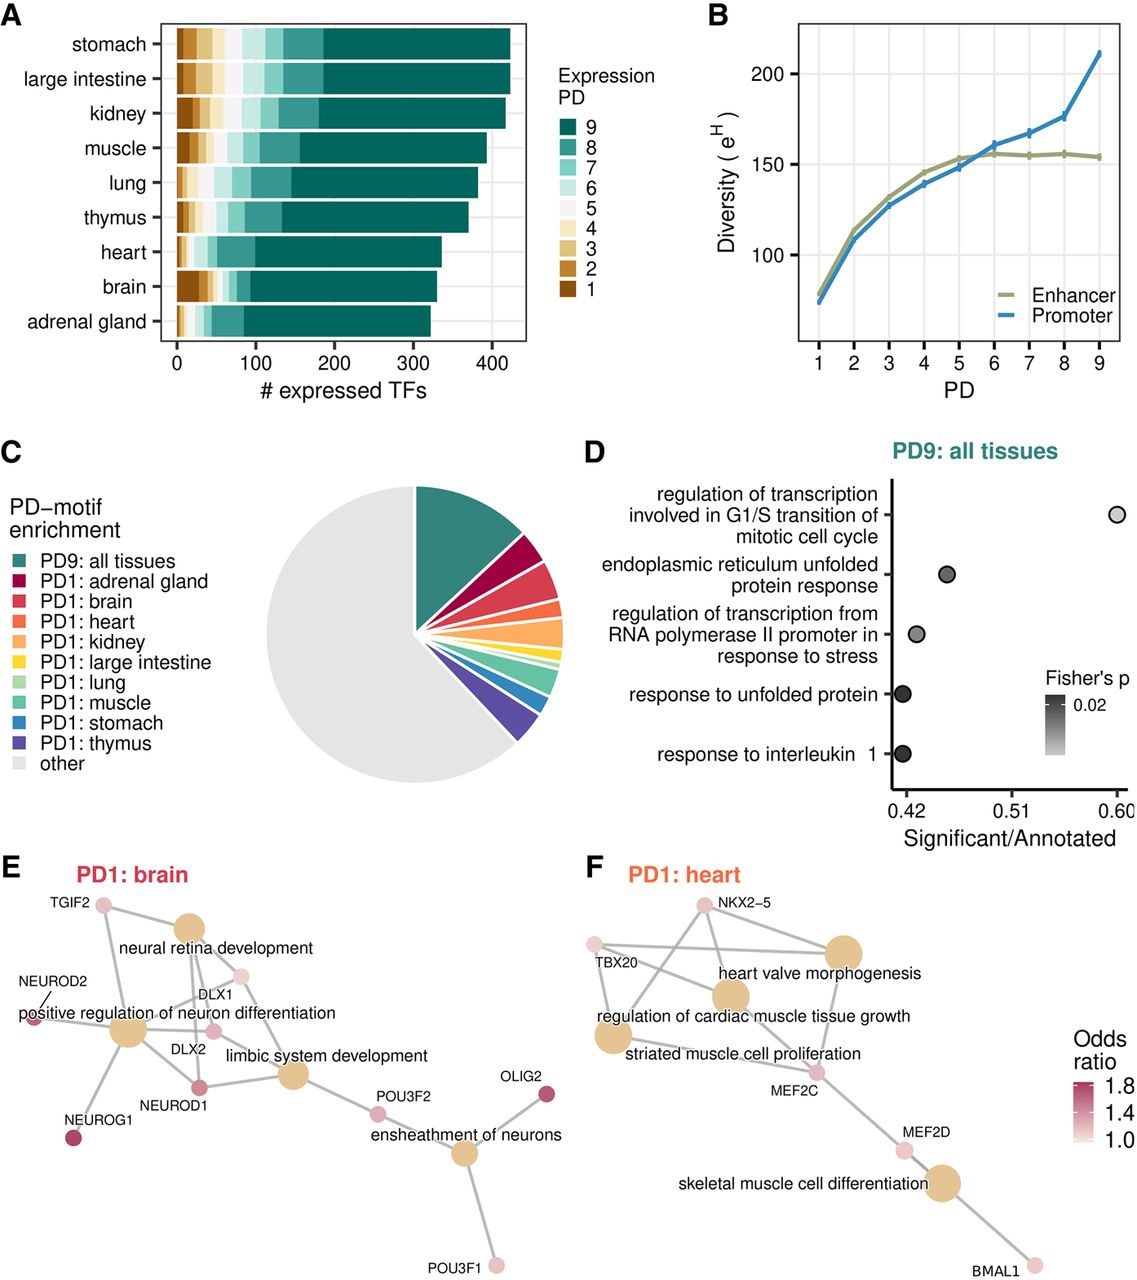
TFBS repertoire diversity and enrichment across tissue-specific and pleiotropic CREs. (A) An overview of the PD of TF expression (EPD) across tissues. (B) TFBS repertoire diversity increases with PD, particularly across promoters. Depicted are mean values ± SEM. (C) Overview of the overrepresented motifs in PD9 and PD1 CRE sequences. Depicted are binding site preferences for 643 motifs, the respective TFs of which are detected in the expression data. If a motif showed the highest binding proportion to PD9 CREs consistently within each tissue-CRE, it was assigned as overrepresented in PD9. If a motif showed the highest binding proportion to a PD1 of a particular tissue, but not that of others, it was assigned as PD1 enriched for that tissue. (D) Top five categories of gene set enrichment analysis of PD9-enriched motifs using all motifs as background (Gene Ontology, biological process, Fisher's exact P-value < 0.05). (E,F) Top four categories of gene set enrichment analysis of tissue-specific PD1 enriched motifs using all motifs as background (Gene Ontology, Biological process, Fisher's exact P-value < 0.05). (E) Brain-specific PD1 overrepresented motifs. (F) Heart-specific PD1 overrepresented motifs. (E,F) Odds ratio is based on the proportion of tissue-specific PD1 CREs with the motif over the global average proportion for that motif.


