
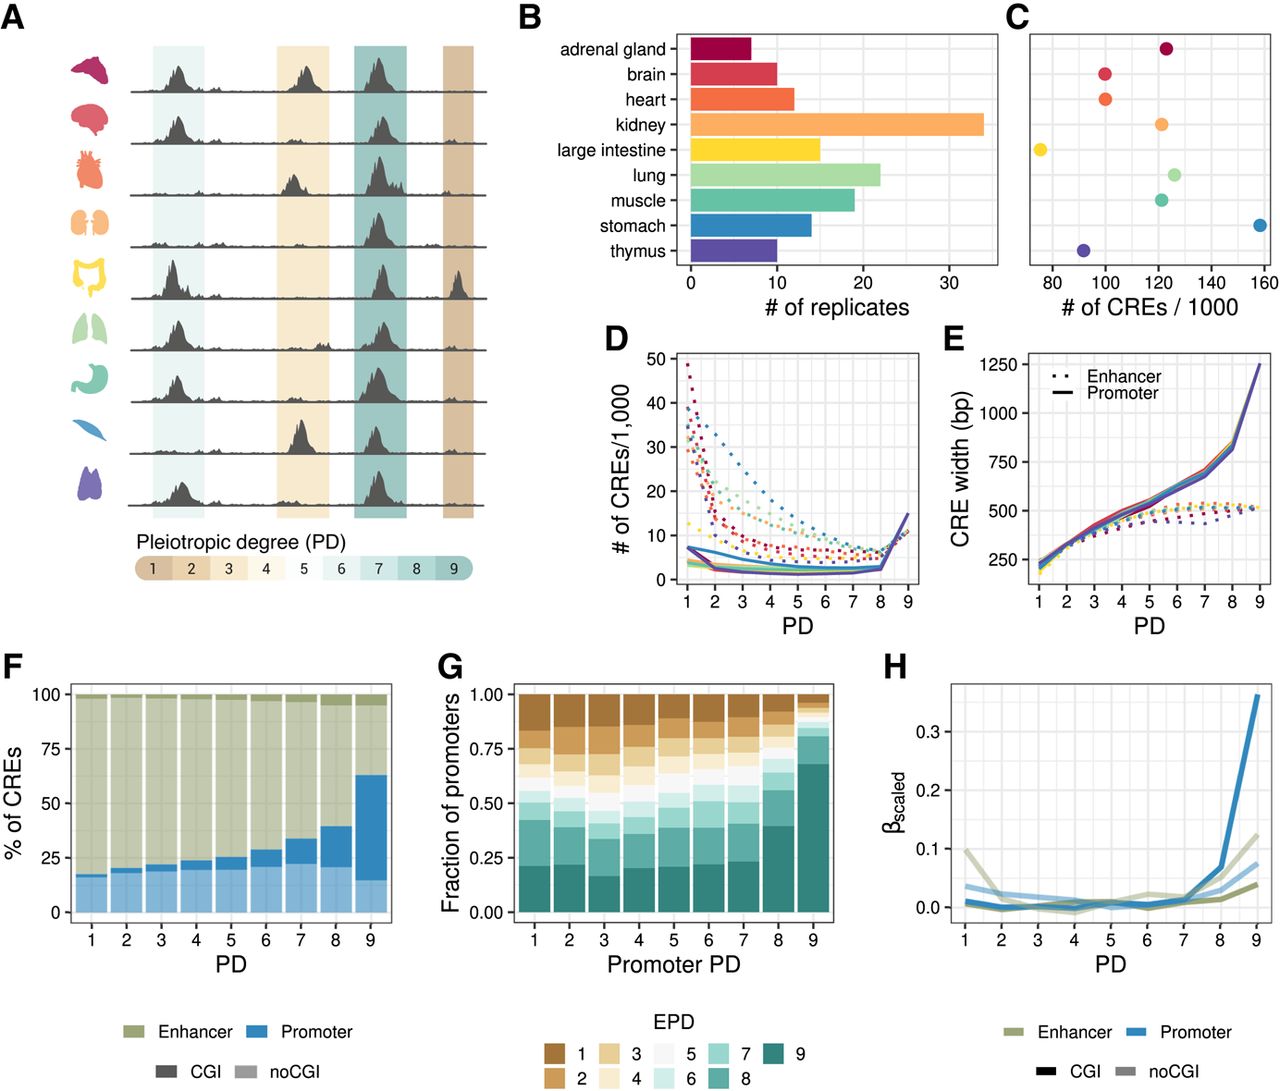
Study overview. (A) Open chromatin and expression data from the Roadmap Epigenomics Project (Bernstein et al. 2010) were used to infer the effect of pleiotropy on sequence and TFBS evolution, as well as associated gene expression in primates. Overlapping DHS peaks between tissues were merged to determine the degree of tissue specificity per CRE. (B) DHS data from nine human fetal tissues. The number of biological replicates per tissue varies between seven and 34. (C) The number of CREs per tissue varies 2.3-fold. There is no association between the number of replicates and the number of accessible regions per tissue. (D) Most enhancers (dotted line) are tissue specific, whereas promoters (solid line) are mostly pleiotropic. (E) CRE length increases with the number of tissues, particularly at the promoters. This increase was also observed at the peak level prior to merging (Supplemental Fig. S1A). (D,E) The colors represent the tissues as introduced in A,B. (F) The majority of PD9 CREs are CpG island promoters (solid blue), whereas tissue-specific elements are rarely CpG islands and mainly enhancers (transparent green). (G) Pleiotropic promoters are more commonly associated with pleiotropic gene expression patterns. The promoter pleiotropic degree (PD) indicates the highest PD of the associated promoters per gene. The y-axis shows the proportions of those x-categories (promoter PD) with associated gene expression pleiotropy ranging from one to nine. (EPD) Expression pleiotropic degree. (H) Scaled coefficients of a linear mixed model to predict gene expression levels using distance scaled CRE counts of different types.


