
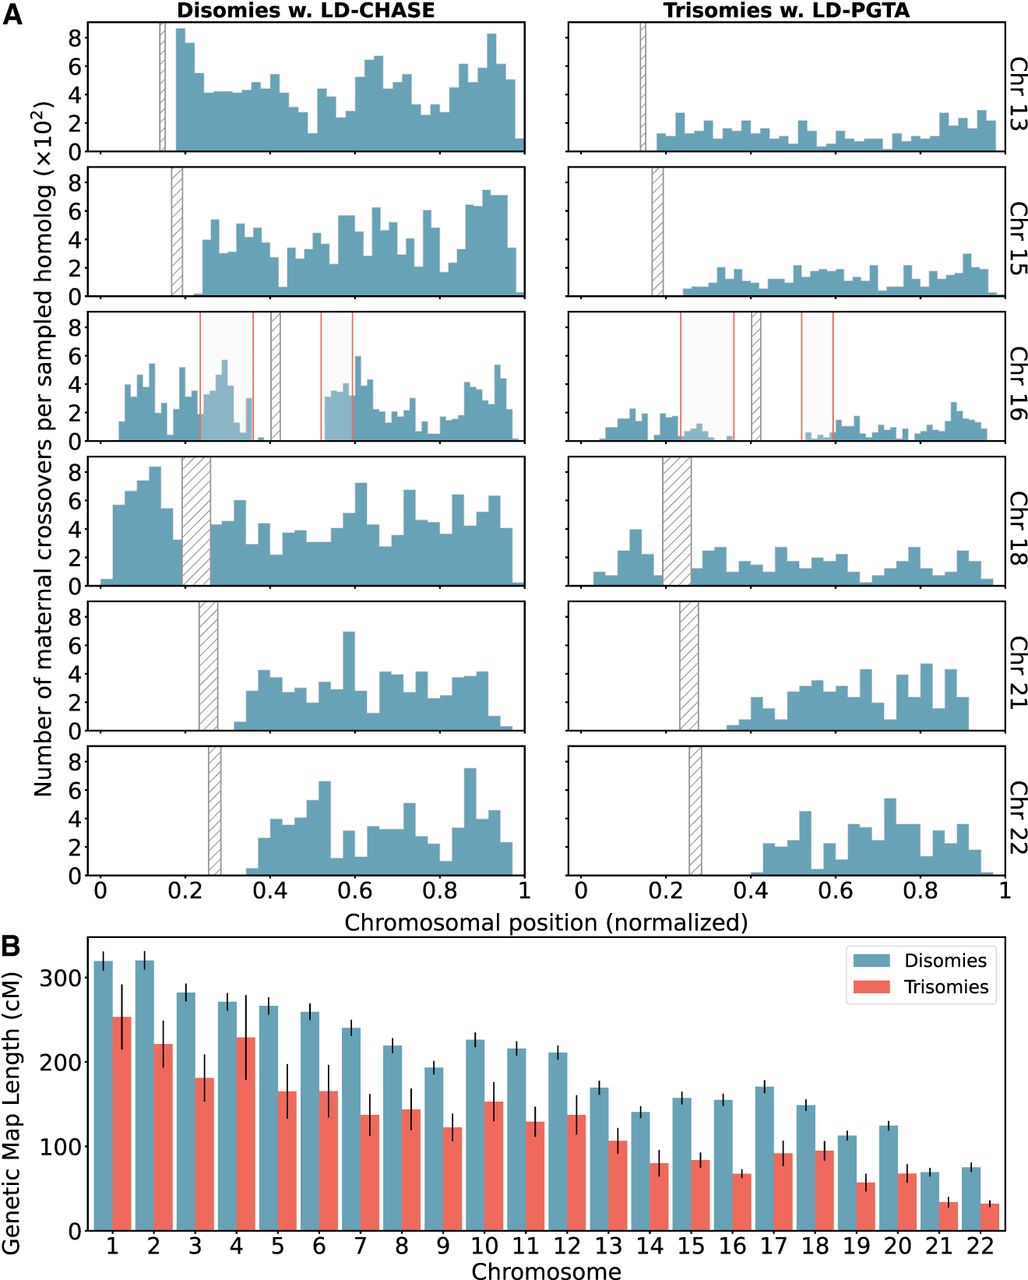
Differences in number and location of inferred crossovers between disomic and trisomic samples. (A) Spatial distributions of inferred meiotic crossovers in disomies (left; mapped with LD-CHASE) and trisomies (right; mapped with LD-PGTA) across Chromosomes 13, 15, 16, 18, 21, and 22. Regions with qualitative differences are highlighted in light gray, whereas centromeres are indicated with diagonal shading. (B) Comparisons of female genetic map length for disomies (blue) versus trisomies (red) for each autosome. The observed rates of meiotic crossover were consistently lower for trisomies compared with disomies. Error bars denote 95% confidence intervals as estimated by bootstrapping.


