
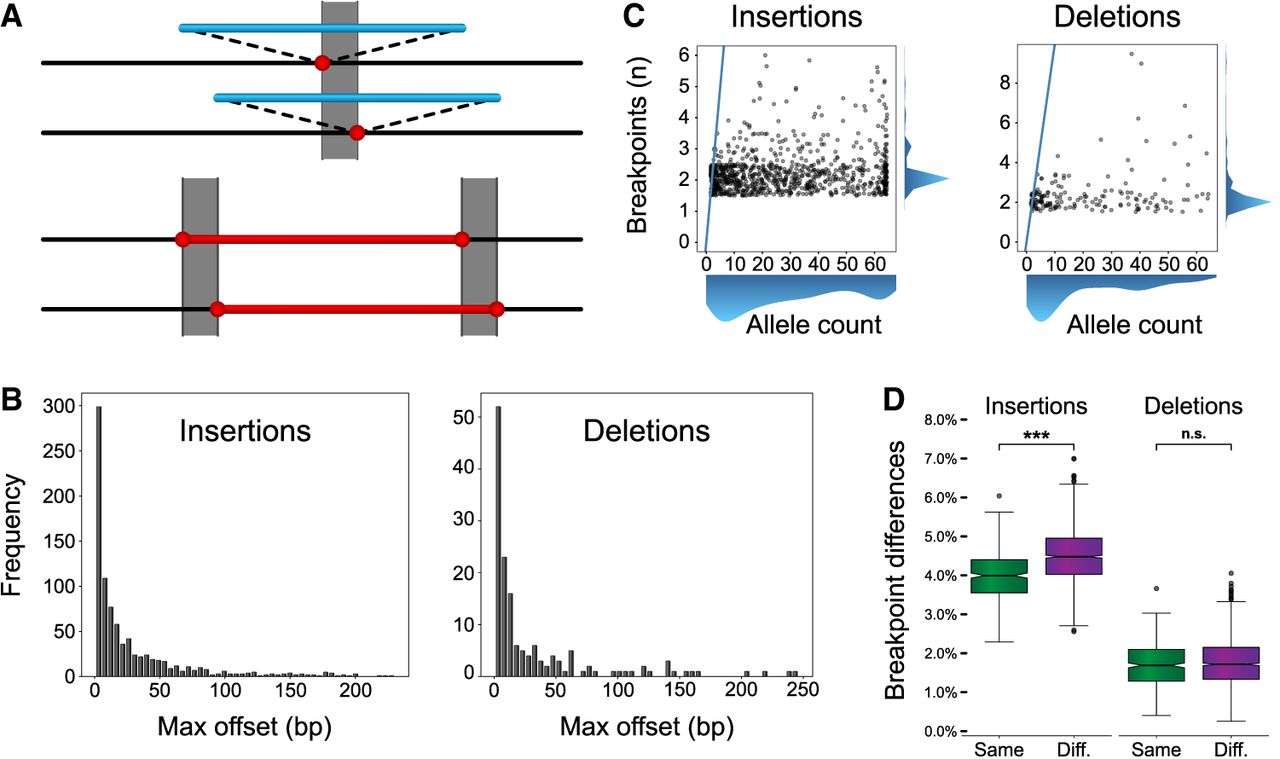
Breakpoint differences and population structure. (A) A cartoon illustration of an insertion (top; blue) and deletion (bottom; red) called at different locations in different samples. The gray box represents the breakpoint difference for these SVs. (B) Maximum offset distances for variants in the merged callset, which is calculated as the distance between the left- and rightmost breakpoints across haplotypes for the same SV. (C) The number of unique breakpoints for each variant (vertical axis) does not scale with the number of haplotypes (horizontal axis). A blue line represents the x = y diagonal. Scatterplot points were jittered in each axis uniformly from −0.5 to 0.5 to show density. (D) For any pair of haplotypes, the proportion of offset SVs is stratified by same superpopulation (Same; green) or different superpopulation (Diff.; violet). The difference in means is significant for both insertions and deletions (Student's t-test of means), but a greater effect is seen for insertions. Notches indicate a 95% confidence interval around the median. (n.s.) Not significant, (*) 1 × 10⁻³ < P ≤ 1 × 10⁻², (**) 1 × 10⁻⁴ < P ≤ 1 × 10⁻³, (***) P ≤ 1 × 10⁻⁴.


