
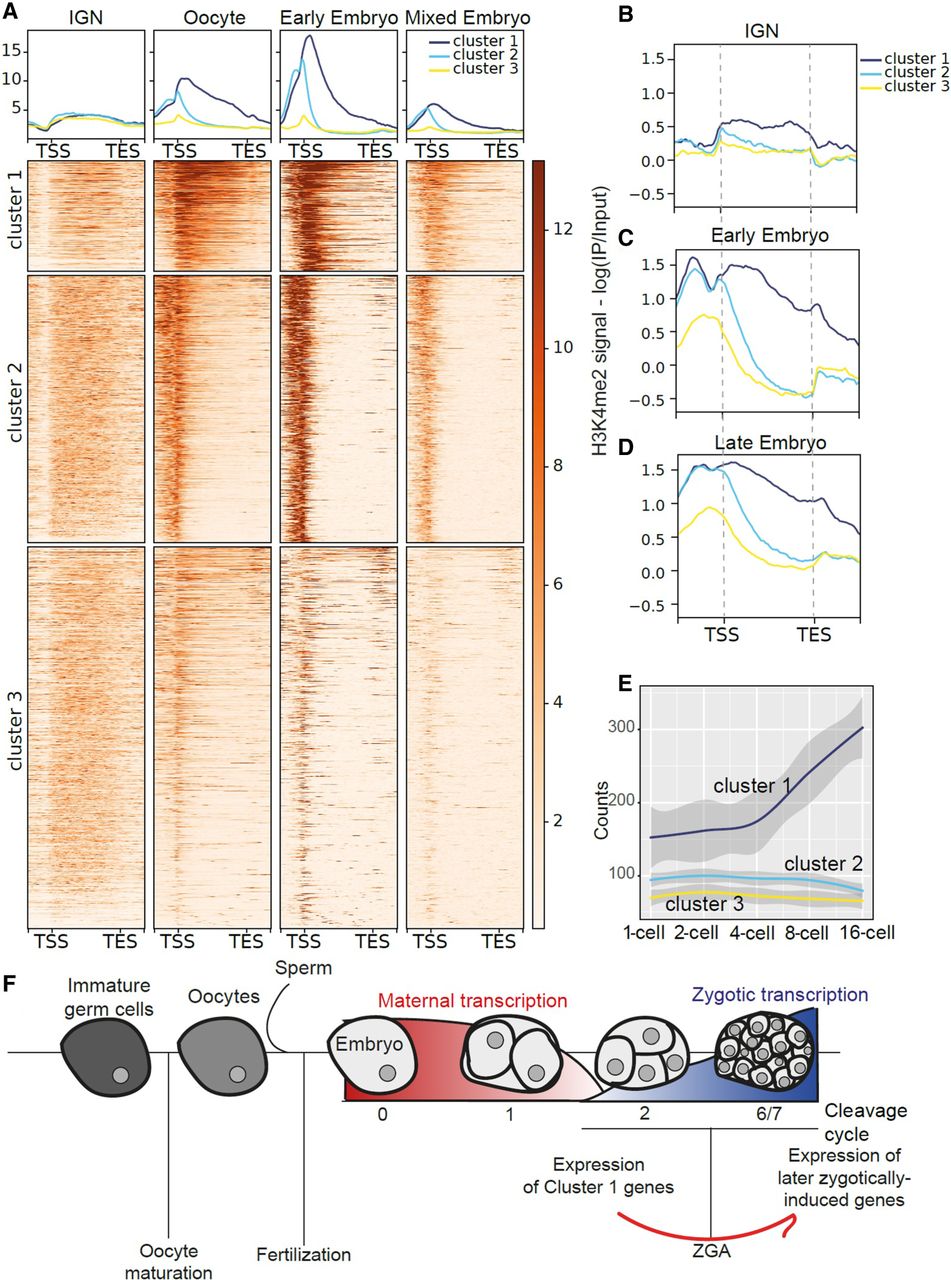
H3K4me3 shows dynamic remodeling during oogenesis. (A) Metagene plots and heatmaps of H3K4me3 signal in IGN (Han et al. 2019), oocytes (Tabuchi et al. 2018), early embryos (Tabuchi et al. 2018), and mixed embryos (Beurton et al. 2019). The heatmap represents H3K4me3 signal along genes that are marked in all developmental stages: Genes are ordered based on signal intensity, and each row represents the same gene in all panels. Genes were clustered using the k-means clustering method. (B–D) Metagene plots of H3K4me2 signal in IGN and early embryos (Liu et al. 2011) and late embryos (Samsudin 2017). (E) Plot of early embryonic expression (Tintori et al. 2016) for genes belonging to the three clusters. Z-score is plotted. (F) Model linking H3K4me3 remodeling during the maternal-to-embryo transition to early expression of cluster 1 genes that leads to more efficient expression of additional genes during zygotic genome activation.


