
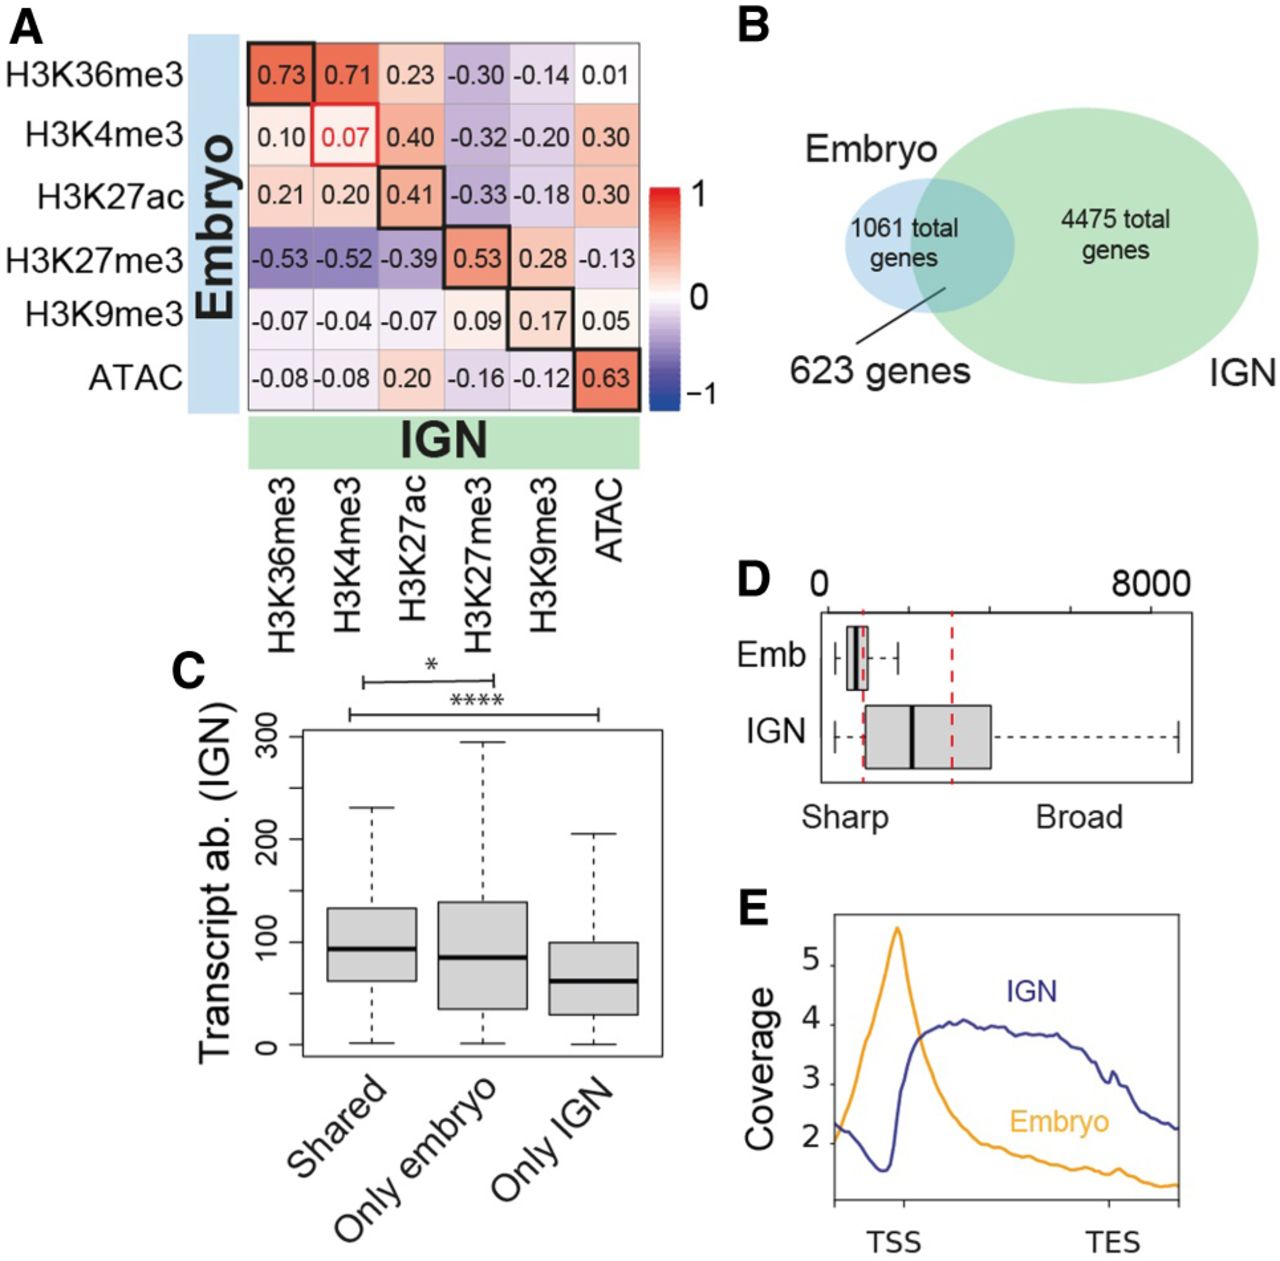
Figure 5.
H3K4me3 distribution differs between IGN and embryo. (A) Pearson's correlation plot for IGN (horizontal) versus embryo (vertical) for each histone modification. (B) Overlap of genes marked by H3K4me3 in IGN versus embryos. Significance assessed by hypergeometric distribution. (C) Transcript abundance in IGN for IGN-specific, embryo-specific, and shared genes. P-value legend: (*) <0.05, (**) <0.005, (***) <0.0005, (****) <0.0005. (D) Breadth of H3K4me3 peaks in embryos (left) and IGN (right). (E) Metagene plots of H3K4me3 signal (as normalized IP/input ratio) around genes marked by H3K4me3 in IGN and embryo.


