
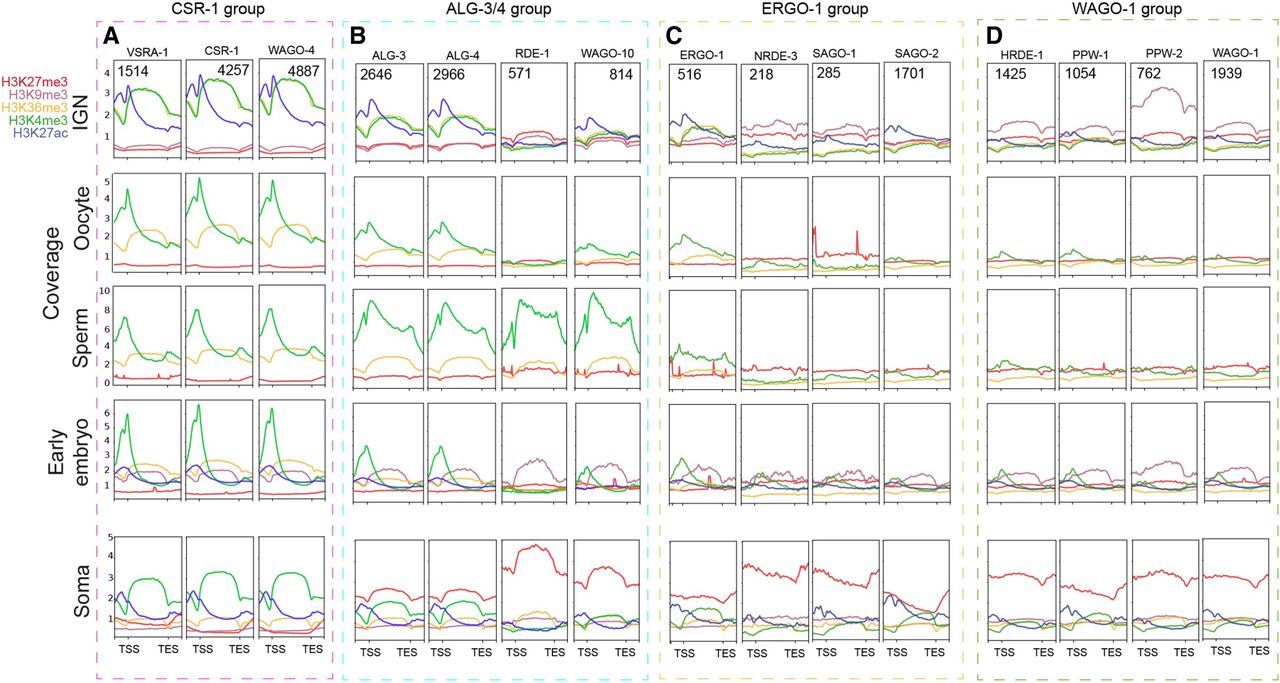
Figure 4.
Chromatin states of AGO target genes. (A–D) Metagene plots of the individual histone marks around target genes of the CSR-1 (A), ALG-3/4 (B), ERGO-1 (C), and WAGO-1 (D) groups for IGN, oocyte, sperm, early embryo, and soma data sets. Normalized signals (as IP/input ratio) were plotted for the upstream region (TSS − 1000 bp), gene body, and downstream region (TES + 1000 bp).


