
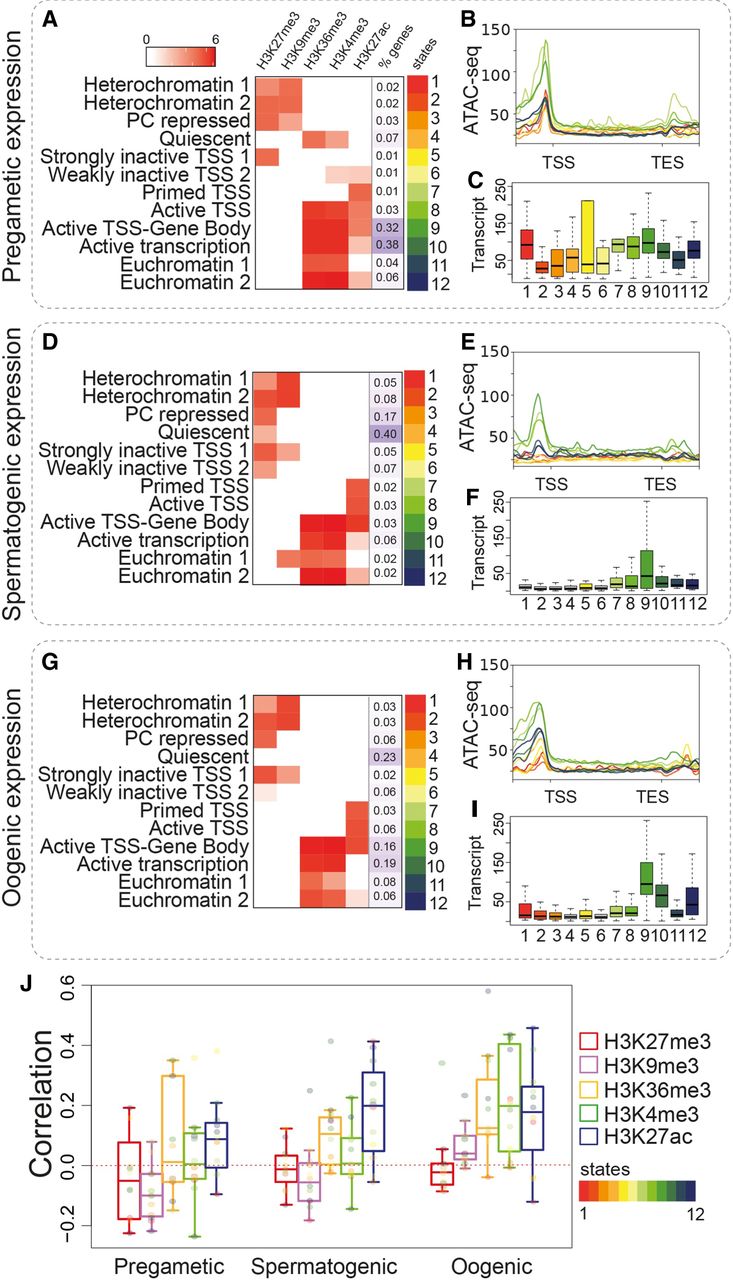
Chromatin states of classes of germline-expressed genes in IGN. (A–C) Pregamete-enriched gene class, (D–F) spermatogenesis-enriched gene class, and (G–I) oogenesis-enriched gene class (Lee et al. 2017). (A,D,G) Heatmap of histone mark coverage in each state, with the percentage of genes in each state to the right. (B,E,H) Chromatin accessibility across chromatin states. Each line represents a chromatin state by assigned color. Normalized signals (as IP/input ratio) were plotted across the upstream region (TSS − 2000 bp), gene body, and downstream region (TES + 2000 bp). (C,F,I) Transcript abundance as FPKM. Values related to each state are plotted. (J) Pearson's correlation between transcript abundance (FPKM) in IGN and histone mark levels (as normalized IP/input signal) for spermatogenic, oogenic, and pregametic gene classes. Each point represents a single chromatin state with the color code as in Figure 1.


