
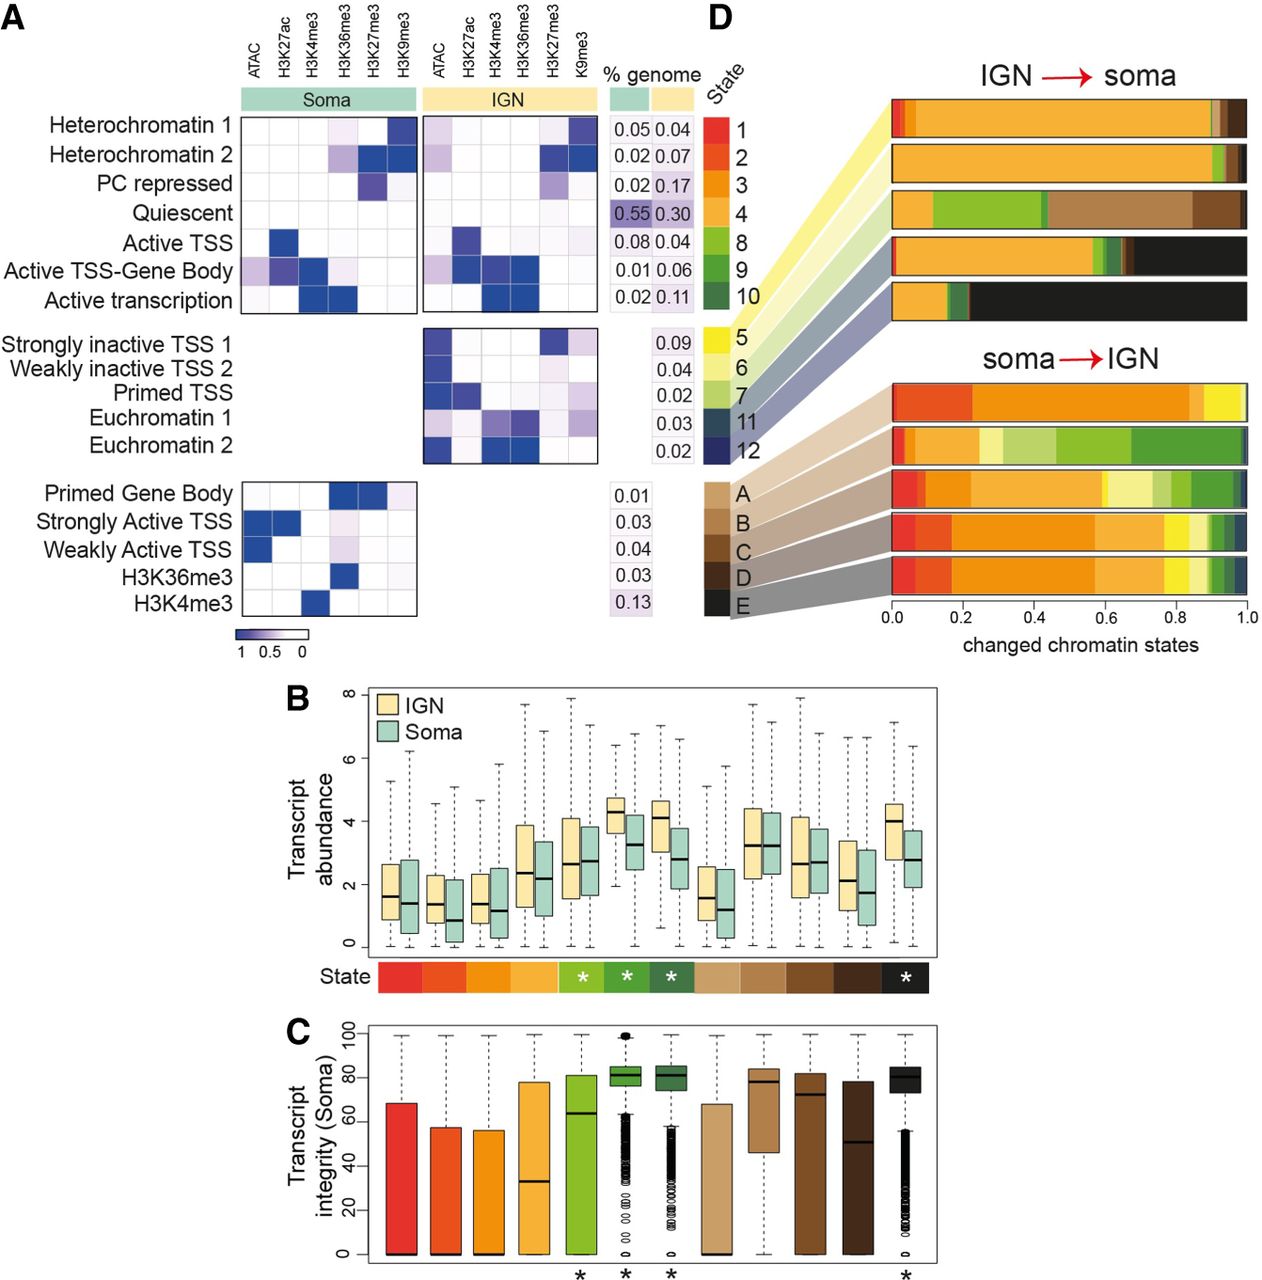
Chromatin states unique to IGN and soma. (A) Annotated chromatin states from adult mixed somatic cells compared with germline states from Figure 1, divided into “shared” states (above), “only-IGN” states (center), and “only-soma” states (labeled A–E in shades of brown; below). The probability of each histone mark or open chromatin for each of the 12 defined states (as a range from zero to one) is plotted as a heatmap, with the percentage of each chromosome in each state at left. (B) Transcript abundance (as log FPKM) of the genes located in each chromatin state found in soma. Asterisks mark active states. (C) Percentage of transcript integrity of the genes located in each chromatin state found in the soma. (D) Altered chromatin state distribution between IGN and soma. For the cumulative fraction of the genome with each unique chromatin state in IGN (5, 6, 7, 11, and 12) or soma (A–E), the shifts to different chromatin states in the opposing tissue are displayed as a barplot, where each color corresponds to a previously defined chromatin state (e.g., IGN-specific state 12 [2% of the genome] mostly [80%] adopts soma-specific state E in the soma).


