
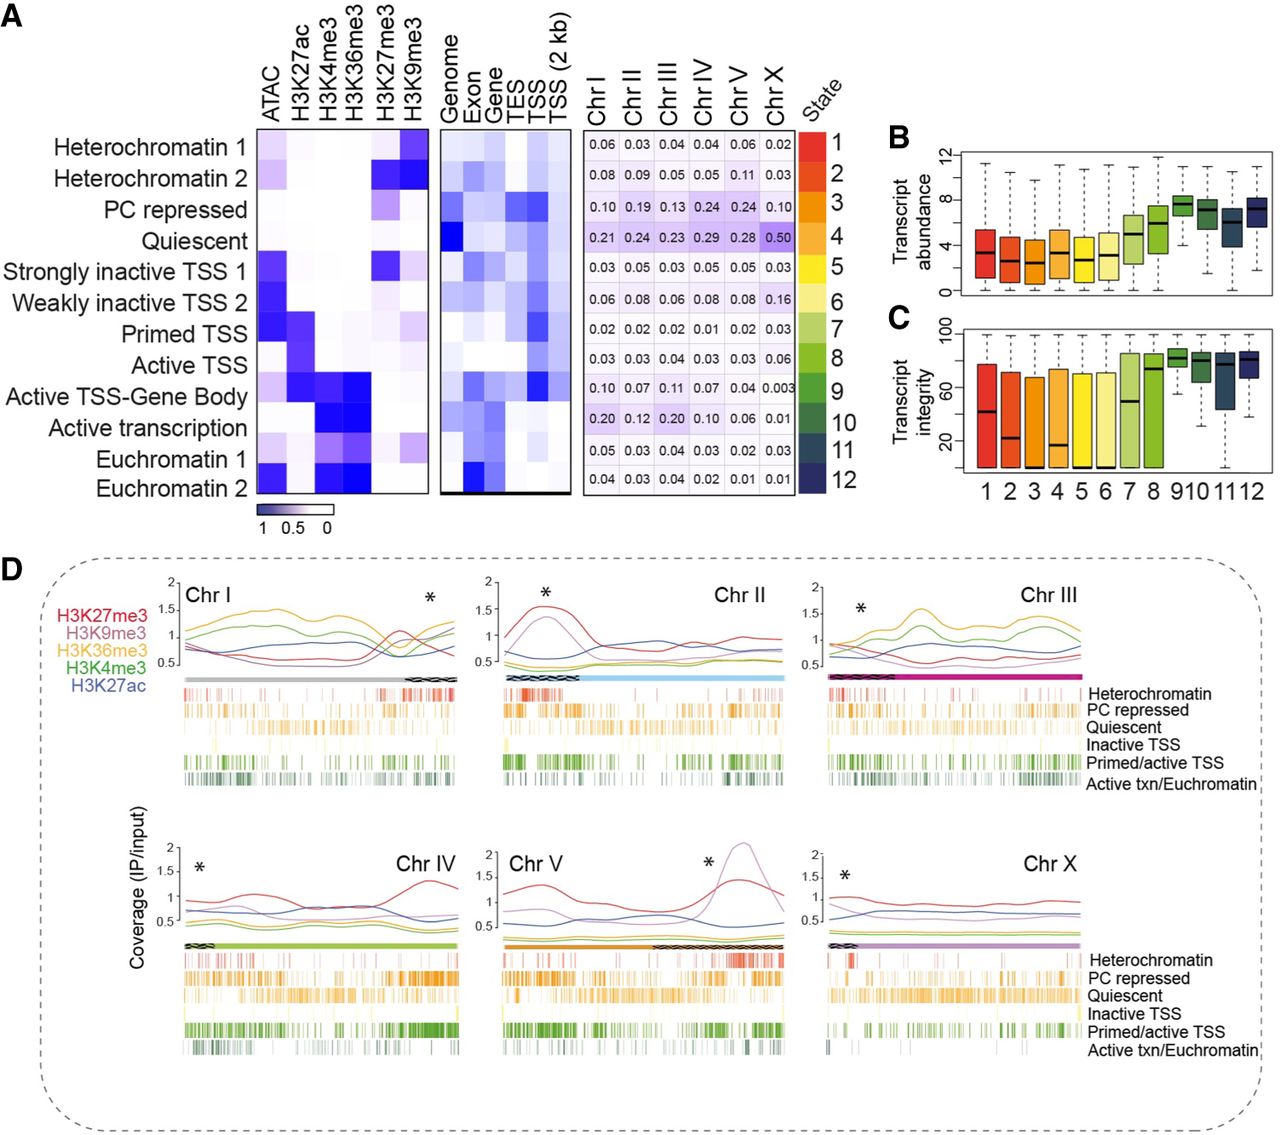
Characteristics of germline chromatin states. (A) Annotated chromatin states from isolated germ nuclei (IGN). (Left) The probability of each histone mark or open chromatin for each of the 12 defined states (as a range from zero to one) is plotted as a heatmap. (Middle) The genomic coverage across gene features for each state. (Right) The percentage of each chromosome in each state. (B) Transcript abundance (as log FPKM) of the genes located within each chromatin state. (C) Percentage of transcript integrity, which measures how prone to degradation a transcript is, of the genes within each chromatin state. (D) Distribution of individual histone modifications along each chromosome, plotted as the normalized signal (IP/input ratio). Asterisks above each chromosome indicate the end at which the pairing center is located, and the hatching on the chromosome indicates the extent of the pairing center. The 12 chromatin states were condensed into six groups of functionally related marks, with the distribution across each chromosome represented by hash marks underneath.


