
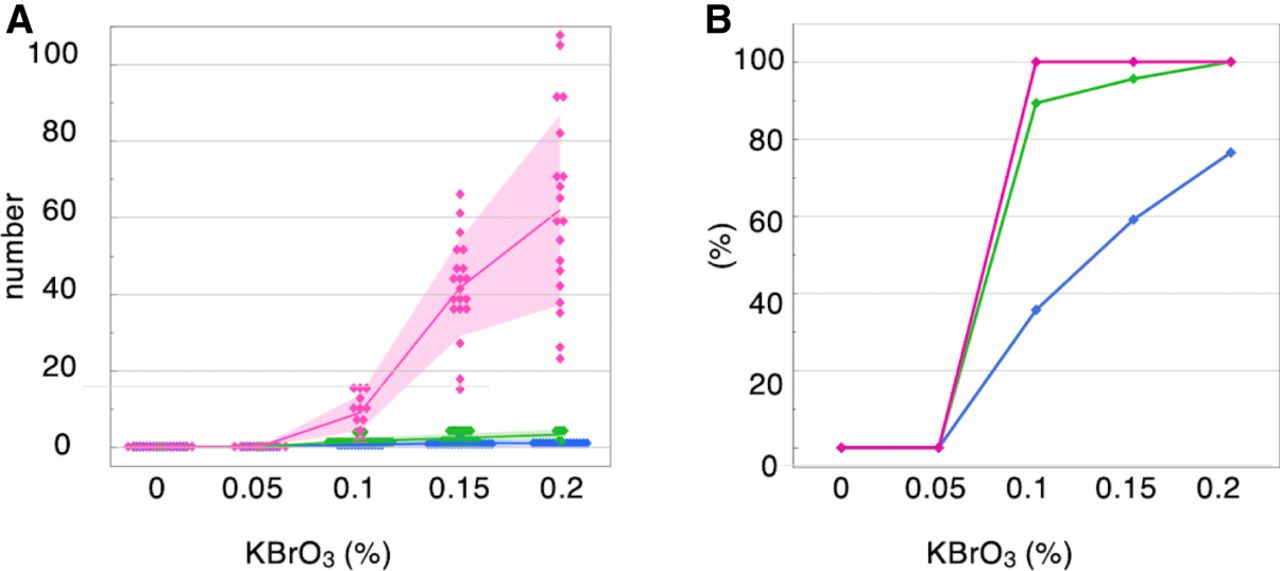
Figure 2.
Dose-dependent increase in intestinal tumors in KBrO3-treated mice. Magenta, green, and blue dots and lines indicate the data of Mutyh−/−, Mutyh+/−, and Mutyh+/+, respectively. (A) The number of tumors per mouse is plotted based on genotype and KBrO3 dose. The line is drawn through the mean values. The pale-colored bands represent ± SD. (B) Tumor prevalence. The percentage of mice with tumor(s) in each study group is plotted against KBrO3 dose.


