
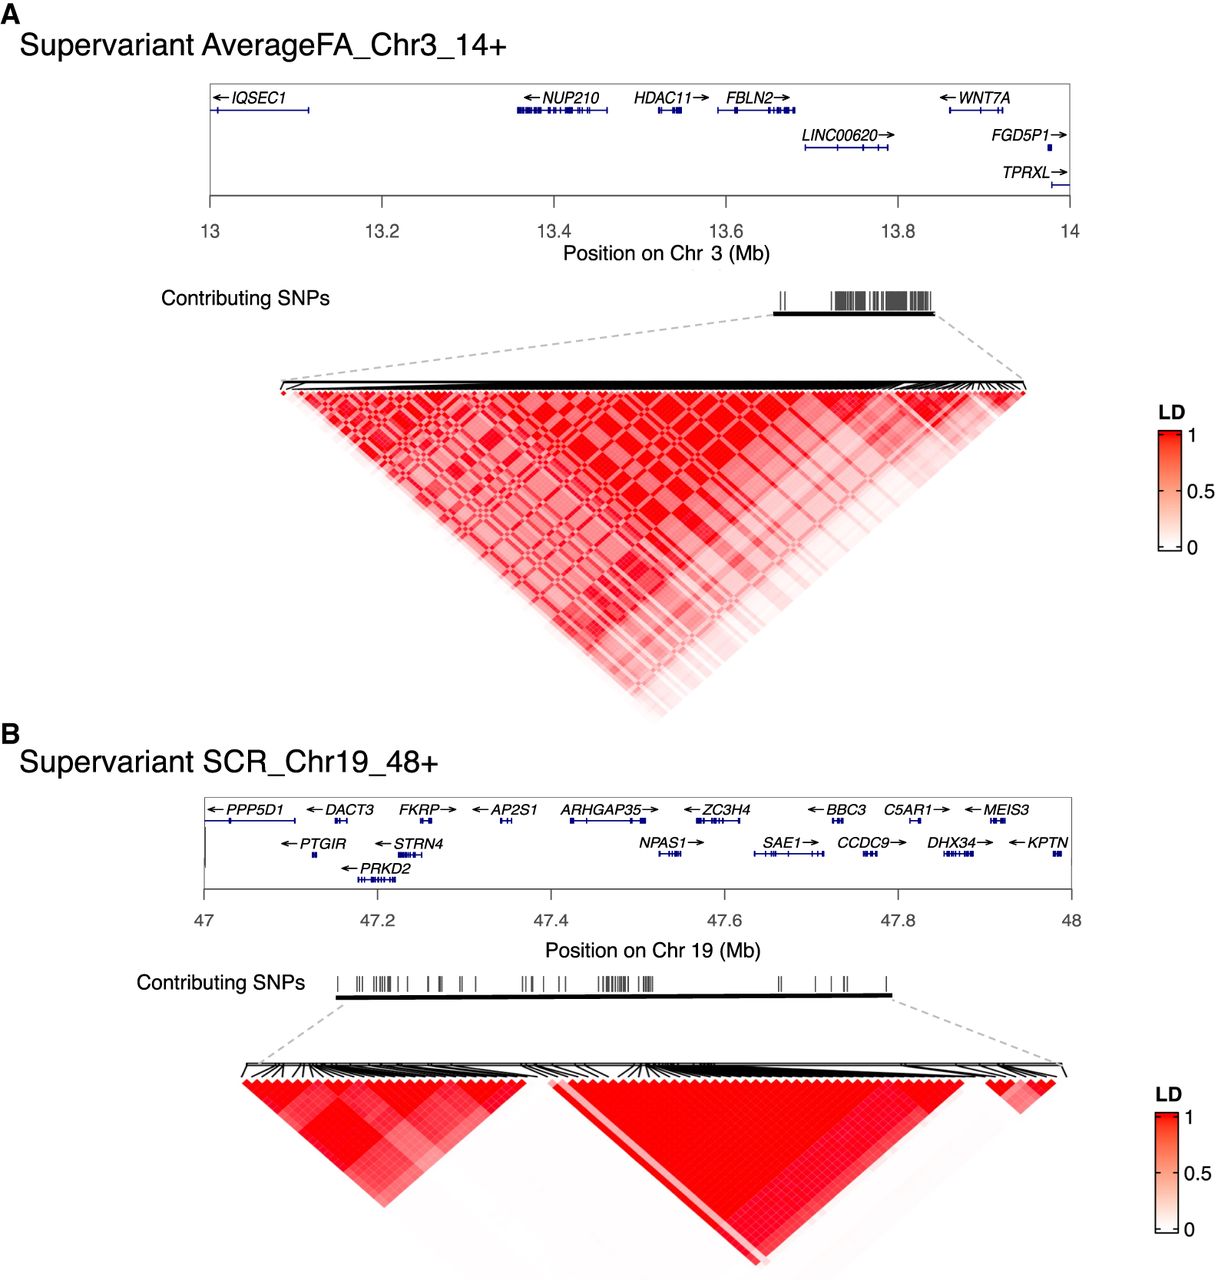
Figure 4.
Selected supervariants and linkage disequilibrium structure. (A) Supervariant AverageFA_Chr3_14+. (B) Supervariant SCR_Chr19_48+. Black lines represent the physical location of selected SNPs on the chromosome. The color scale represents the linkage disequilibrium (r2) between each pair of selected SNPs.


