
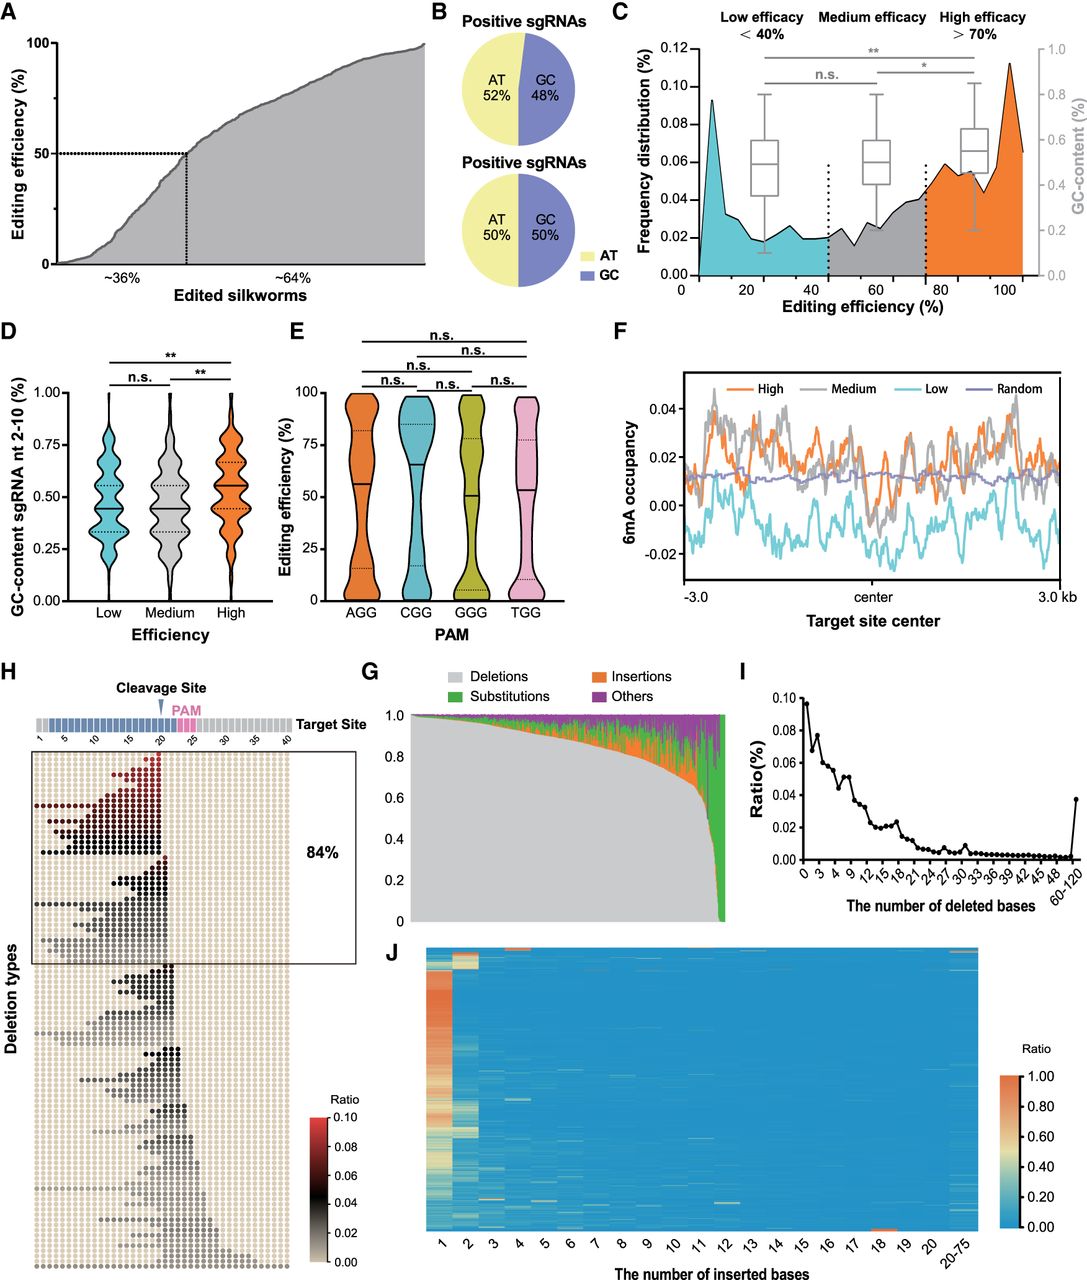
Genotypic characterization and editing outcome of the mutant library. (A) The overall editing efficiency of the edited silkworms. (B) The GC content in the positive and negative sgRNAs. (C) Frequency of distribution of editing efficiency and the GC content in high (editing efficiency > 70%)-efficiency, medium-efficiency, and low-efficiency (editing efficiency < 40%) sgRNA groups: (*) P < 0.05, (**) P < 0.01, (n.s.) not significant; one-way ANOVA with Benjamini–Hochberg post-test multiple comparison. (D) The GC content of different editing efficiency: (*) P < 0.05, (**) P < 0.01, (n.s.), not significant; one-way ANOVA with Benjamini–Hochberg post-test multiple comparison. (E) The editing efficiency of different PAM sequences: (*) P < 0.05, (**) P < 0.01, (n.s.), not significant; one-way ANOVA with Benjamini–Hochberg post-test multiple comparison. (F) The DNA 6mA methylation occupancy around the target center with different editing efficiencies. (G) The overall editing patterns of the edited silkworms. (H) The top 100 deletion types and their percentages. (I) The size of the deletions and their occurrences. (J) The size of the insertions and their percentage.


