
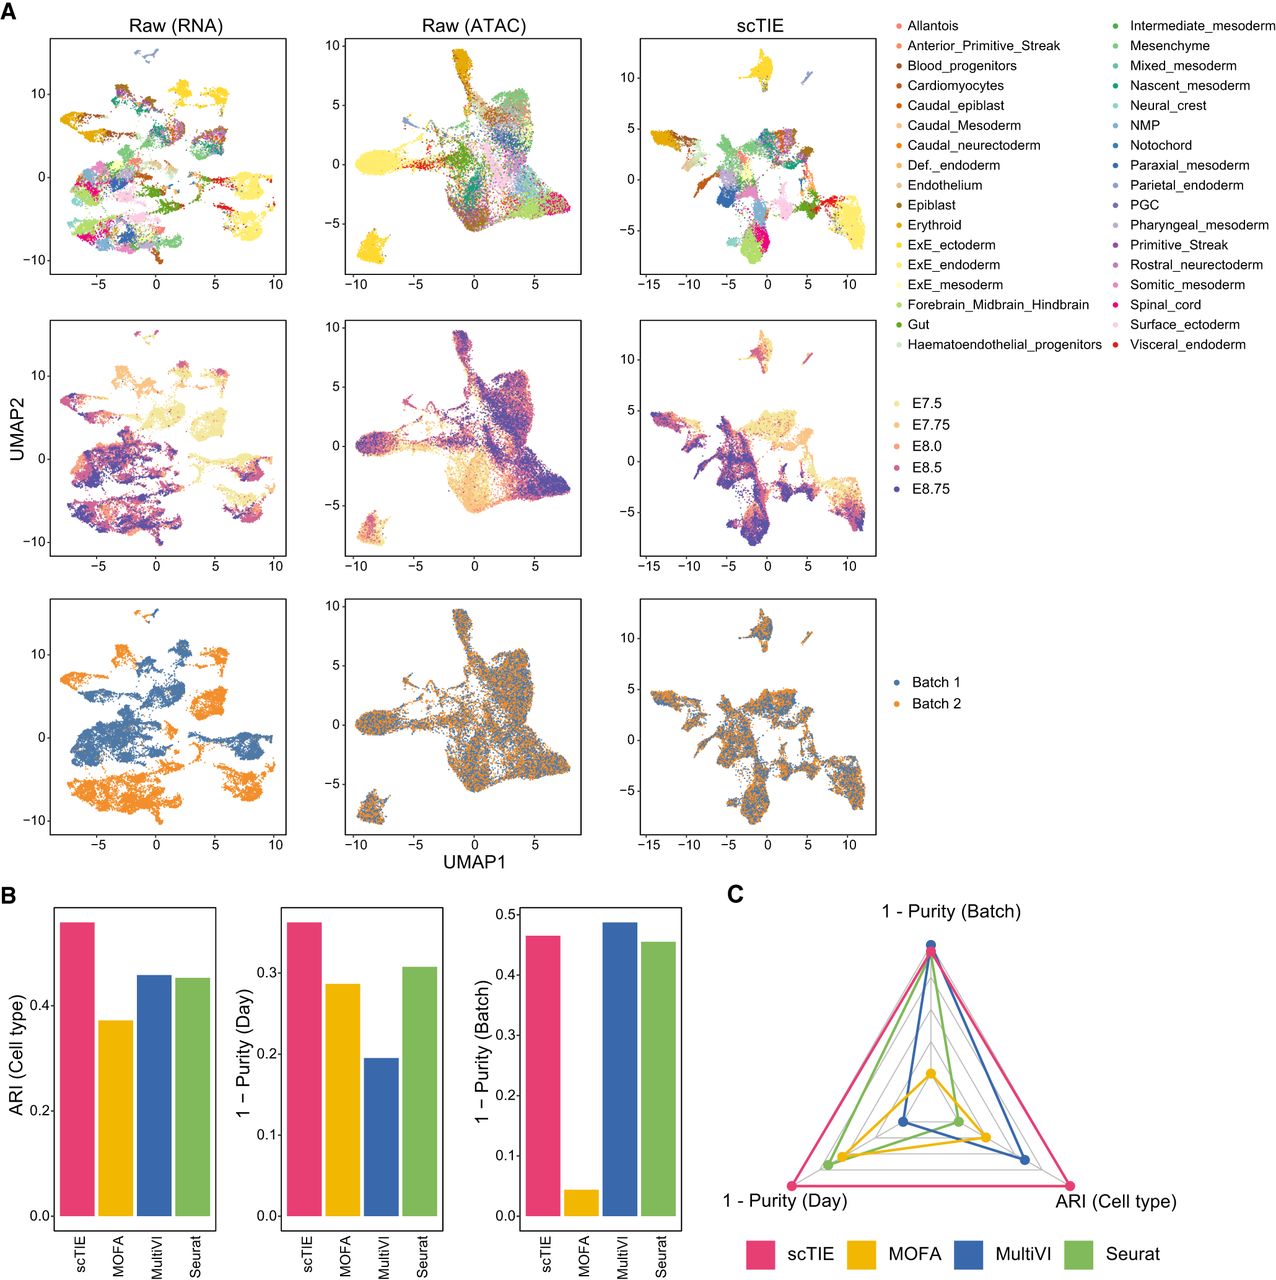
Performance benchmarking for integrating temporal multimodal data. (A) Joint visualization using UMAP of the synthetic data set with batch effect in RNA and noise in ATAC, colored by cell type annotations (top), sampling days (middle), and synthetic batch information (bottom). Each dot represents a cell in the embedding space. (B) Bar plots showing the evaluation metrics of different data integration methods, including ARI values for clustering with annotations (left), 1 − average purity scores of sampling days with the number of neighbors equal to 50 (middle), and 1 − average purity scores of the synthetic batch with the number of neighbors equal to 50 (right). Higher values indicate better agreement with annotations and mixing of batches/days. (C) Radar plot summarizing the three evaluation metrics shown in B, in which each line represents the performance of one method, and each axis represents an evaluation metric, starting from the minimum value of all methods. It is noted that scAI was not included in this benchmarking owing to its long computational time (>2 d).


