
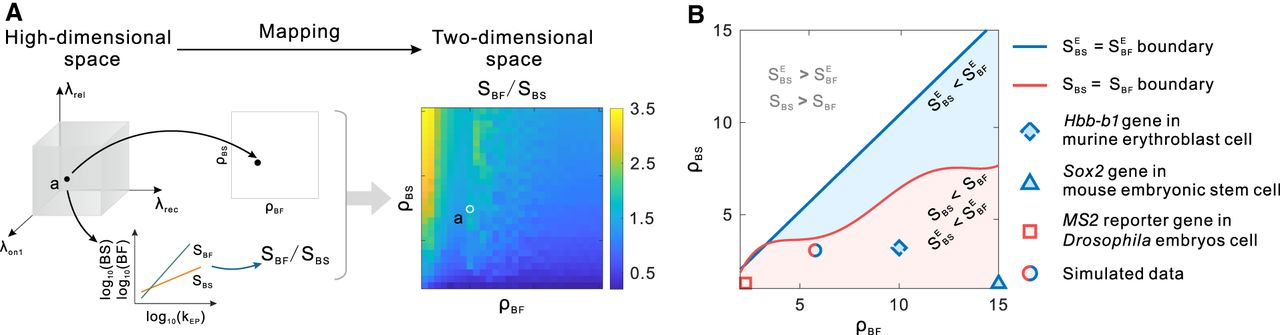
Separatrixes for power-law behaviors of BS and BF in the (ρBF, ρBS) plane. (A) Schematic illustration of the dimension reduction method, in which a high-dimensional parameter space is mapped into the
(ρBF, ρBS) space, and the calculated values of SBF/SBS (the bottom inset) are plotted in the (ρBF, ρBS) plane (the heatmap). (B) The red line stands for the boundary obtained by smoothing the theoretical results SBF/SBS; the blue line, for the boundary obtained by smoothing the theoretical results  (after enhancer deletion). The colored regions indicate that E-P communication affects BF more than BS under different situations.
The square at point (2.3, 1.3) corresponds to the MS2 reporter gene in Drosophila embryos cell in work of Fukaya et al. (2016), the triangle at point (15, 1.4) to the Sox2 gene in mouse embryonic stem cell in work of Larsson et al. (2019b), the dashed diamond at point ( · , 3.3) to the Hbb-b1 (hemoglobin, beta) gene in murine erythroblast cell in work of Bartman et al. (2016), and the red blue mixed circle to the simulated data. Note that the burst frequency in work of Larsson et al. (2019b) defined as the reciprocal of OFF state dwell-time, which is approximately converted to the reciprocal of CT, and that the
ρBF at the dashed diamond point ( · , 3.3) related to burst fraction in work of Bartman et al. (2016) is approximate. By the blue region, we mean the whole area below the blue line (some part is covered by red regions).
(after enhancer deletion). The colored regions indicate that E-P communication affects BF more than BS under different situations.
The square at point (2.3, 1.3) corresponds to the MS2 reporter gene in Drosophila embryos cell in work of Fukaya et al. (2016), the triangle at point (15, 1.4) to the Sox2 gene in mouse embryonic stem cell in work of Larsson et al. (2019b), the dashed diamond at point ( · , 3.3) to the Hbb-b1 (hemoglobin, beta) gene in murine erythroblast cell in work of Bartman et al. (2016), and the red blue mixed circle to the simulated data. Note that the burst frequency in work of Larsson et al. (2019b) defined as the reciprocal of OFF state dwell-time, which is approximately converted to the reciprocal of CT, and that the
ρBF at the dashed diamond point ( · , 3.3) related to burst fraction in work of Bartman et al. (2016) is approximate. By the blue region, we mean the whole area below the blue line (some part is covered by red regions).


