
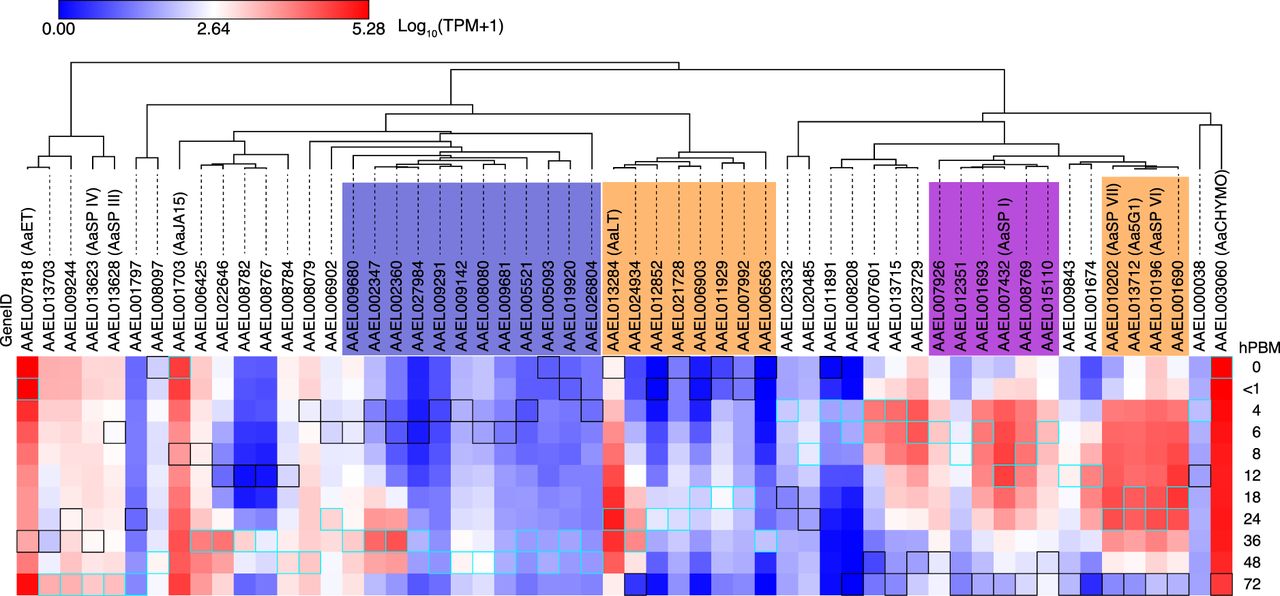
Figure 6.
Expression patterns of SPs with 1.5 < log10 (TPM + 1) at least one time point. Genes were hierarchically clustered by expression patterns. Maximum and minimum values across the time course are indicated by cyan and black squares, respectively. For the groups indicated by colored shadings, see text.


