
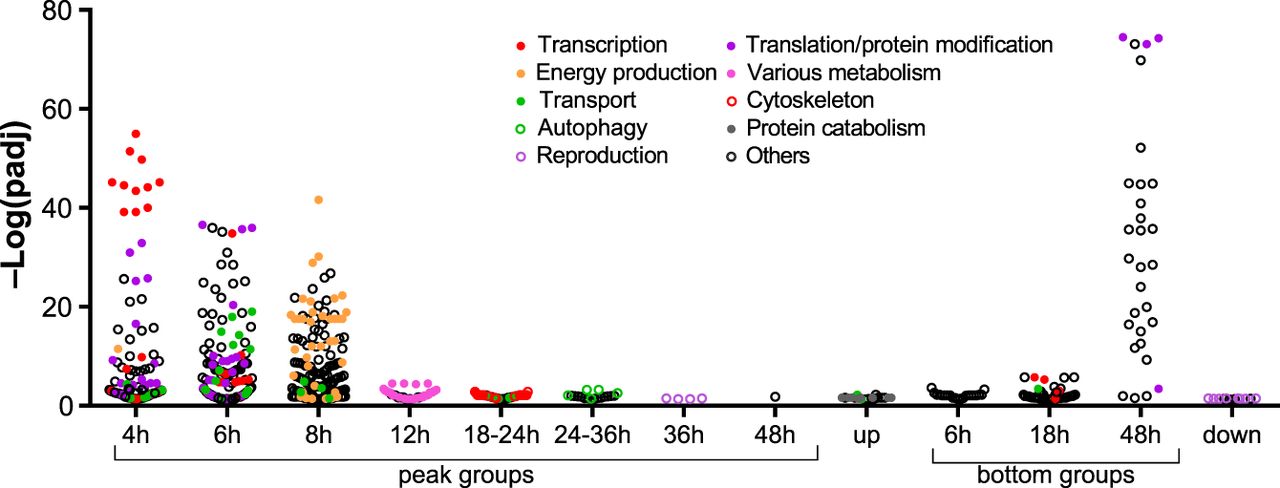
Figure 3.
–log plot of Benjamini–Hochberg-adjusted P-values (P < 0.05) for GO enrichment analysis (biological process) for each cluster. Colors are applied for the related terms discussed in the text; for example, red-filled circles are GO terms related to transcription.


