
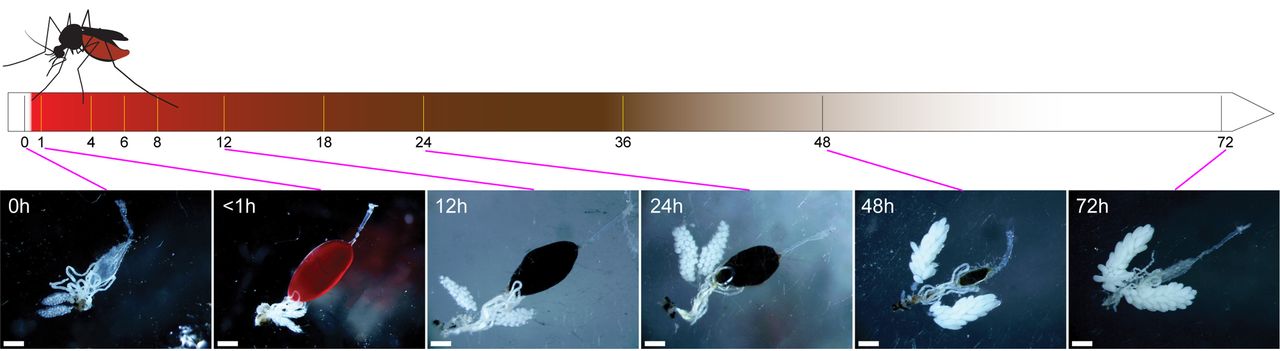
Figure 1.
Time line for the midgut transcriptome sample collection time points with images of the gut system and ovaries for selected time points. Images of all the time points are shown in Supplemental Figure S1. Scale bar (white bar in each panel), 500 μm.


