
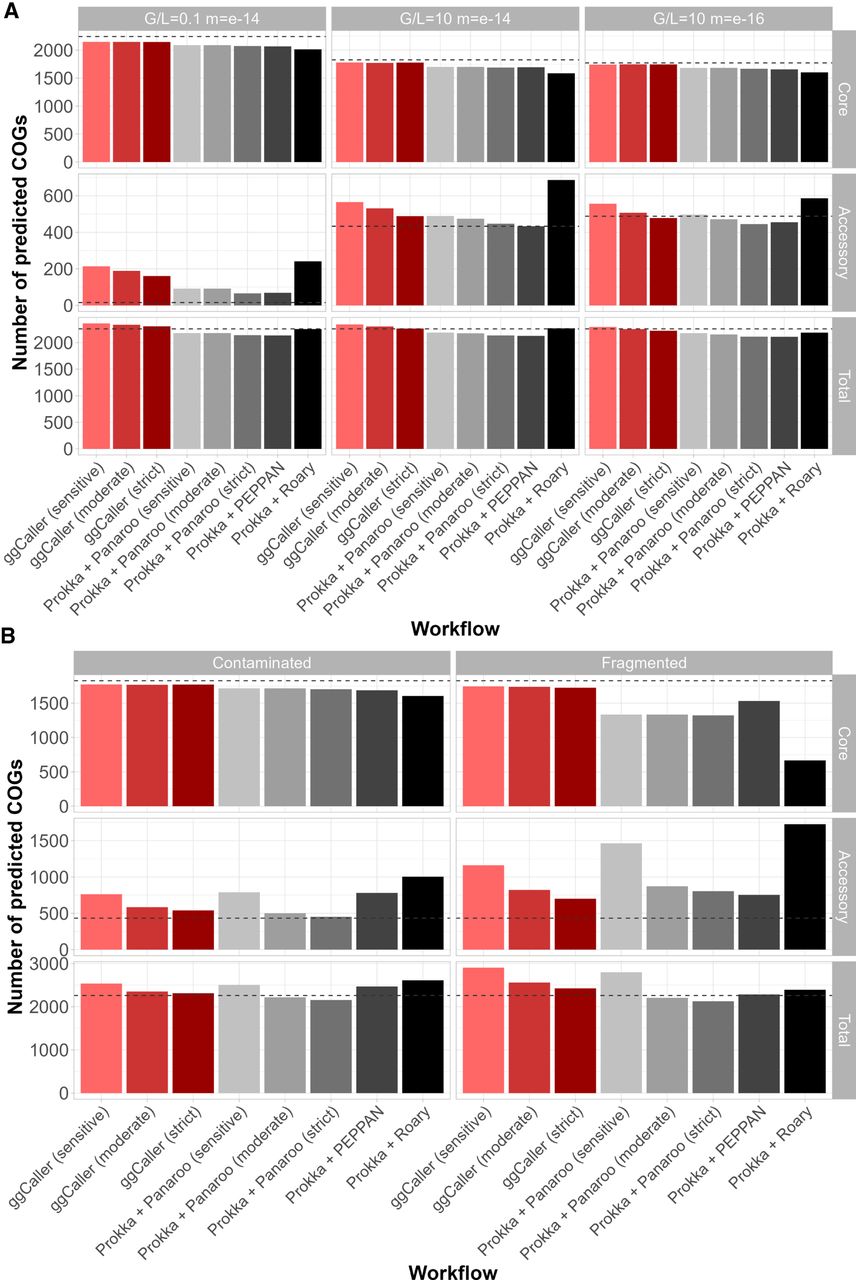
Figure 3.
Comparison of estimated core, accessory, and total pangenome sizes across simulated populations. Panels describe simulations with simple (A) and complex (B) sources of error. Bars indicate the predicted number of COGs for each workflow. Ground-truth values are represented by the gray dotted line in each panel. Horizontal panels describe simulation parameters; vertical panels describe COG frequency: core (99% ≤x ≤ 100%; top), accessory (0 ≤x < 99%; middle), and total (0 ≤x ≤ 100%; bottom).


