
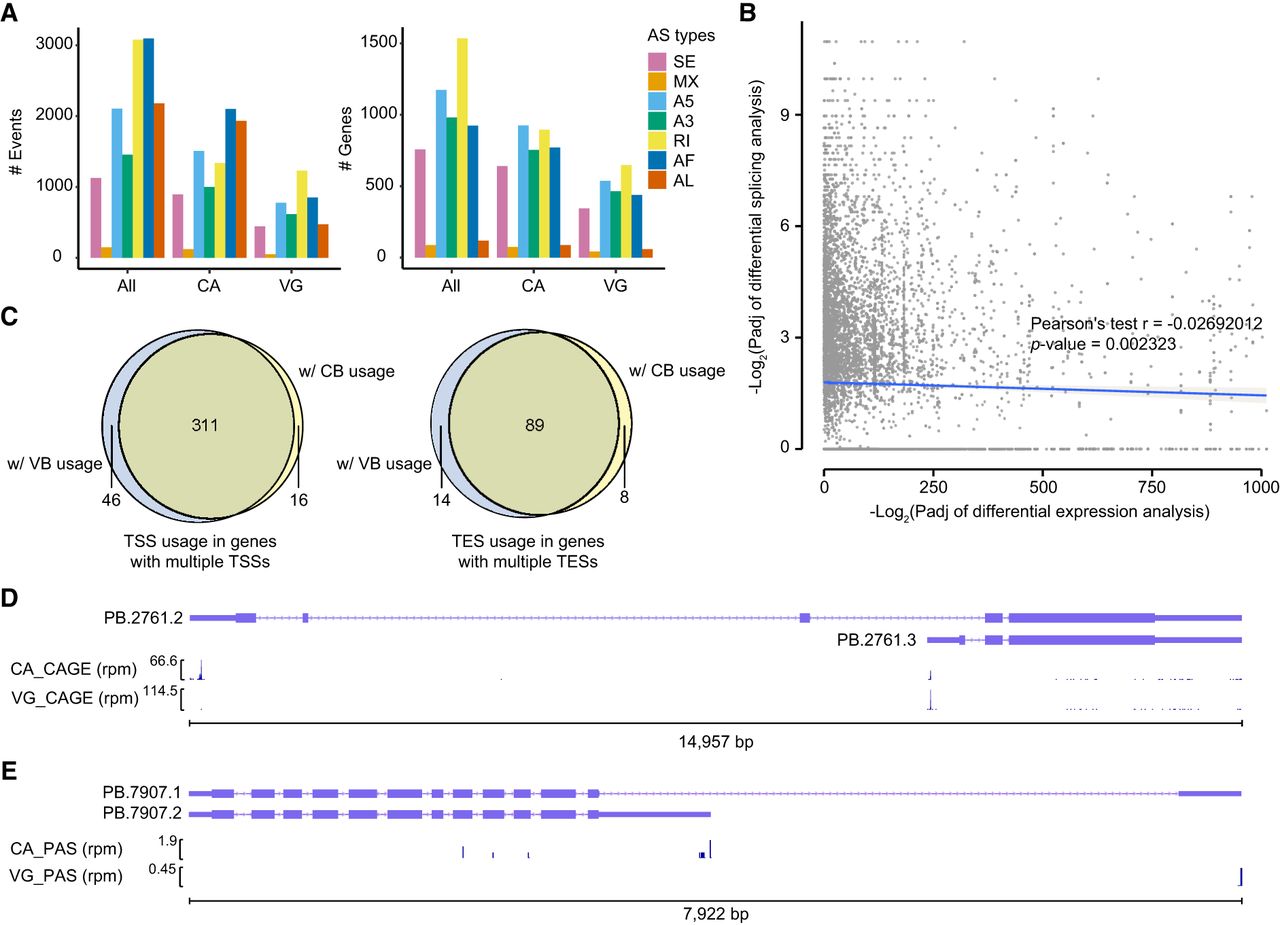
Differential alternative RNA processing events between the venom gland and carcass. (A) Statistical analysis of alternative splicing (AS) events and AS genes in three gene sets: all genes (All), genes expressed in the venom gland (VG), and genes expressed in the carcass (CA). Expressed genes were defined as those with TPM values higher than 1 in at least one replicate of the corresponding sample. The chart displays seven types of AS events: skipping exon (SE), mutually exclusive exons (MX), alternative 5′/3′ splice sites (A5/A3), retained intron (RI), and alternative first/last exons (AF/AL). (B) Scatter plot illustrating the relationship between differentially spliced genes (DSG) and differentially expressed genes (DEG). Pearson correlation analysis revealed no significant association between the DSGs and DEGs. The lines represent linear regressions, and the shaded areas depict 95% confidence intervals around the mean predictions. (C) Alternative usage of transcription start sites (TSS) in genes with multiple TSSs and alternative usage of transcription end site (TES) in genes with multiple TESs. We identified 311 genes with at least one venom gland-biased TSS and one carcass-biased TSS, as well as 89 genes with at least one venom gland-biased TES and one carcass-biased TES. (D) An example of a gene exhibiting distinct TSS usage between the venom gland and carcass, resulting in two different isoforms. The panels show isoforms, CAGE-Seq in the carcass, and CAGE-Seq in the venom gland. (E) An example of a gene with distinct TES usage between the venom gland and carcass. The panels display isoforms, PAS-Seq in the carcass, and PAS-Seq in the venom gland. (rpm) reads per million.


