
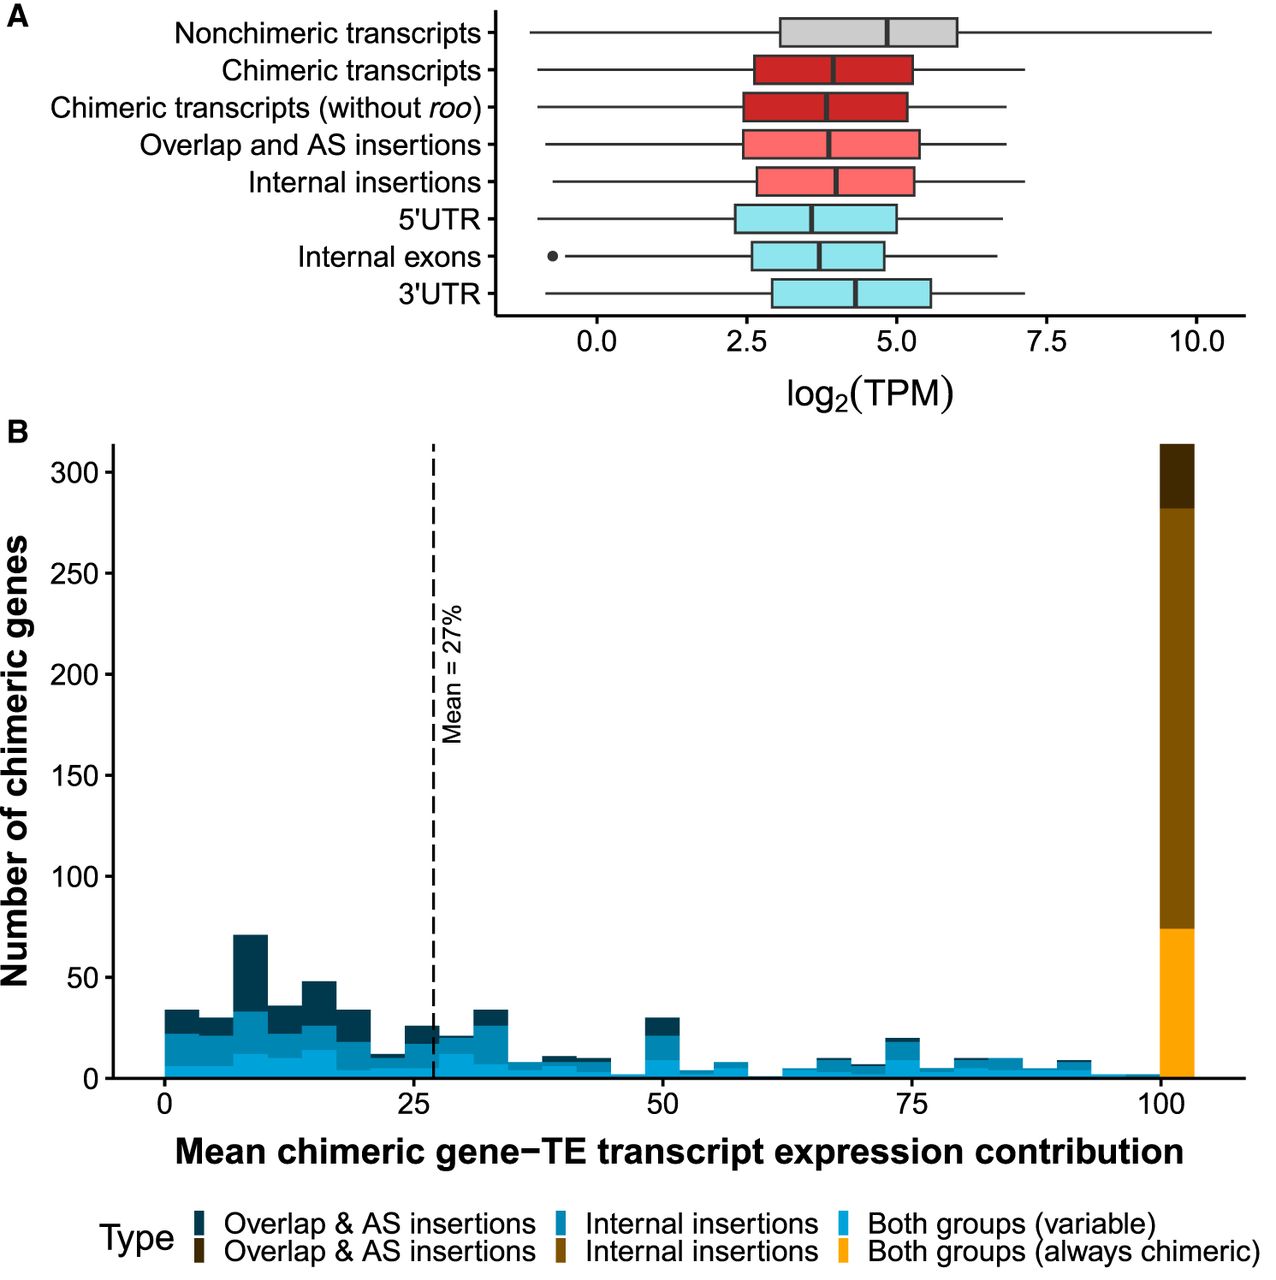
TE insertions within genes affect gene expression. (A) Boxplots for the expression levels, measured as the logarithm of TPM (TPM ≥ 1): for all nonchimeric transcripts of the genome (19,228; in gray), all chimeric transcripts detected in the present study (1909; in dark red), chimeric transcripts without the short internal roo insertion (1073; dark red), all chimeric transcripts belonging to the overlap and AS insertion group (472; light red) and the internal insertion group (1156; light red), and chimeric transcripts divided by position of the insertion (5′ UTR: 354, internal exons: 445, 3′ UTR: 799; cadet blue). (B) Histogram showing the expression contribution of chimeric transcripts to the total gene expression. Blue bars represent the contribution of variable chimeric genes (505 genes), ranging from ∼0.1% to >90% (mean = 27%), and the orange/brown bar represents the genes that always produced chimeric transcripts in all the genomes and body parts in which expression was detected (314 genes). Both groups correspond to genes that generate chimeric transcripts belonging to the overlap and AS insertion group and to the internal insertion group.


