
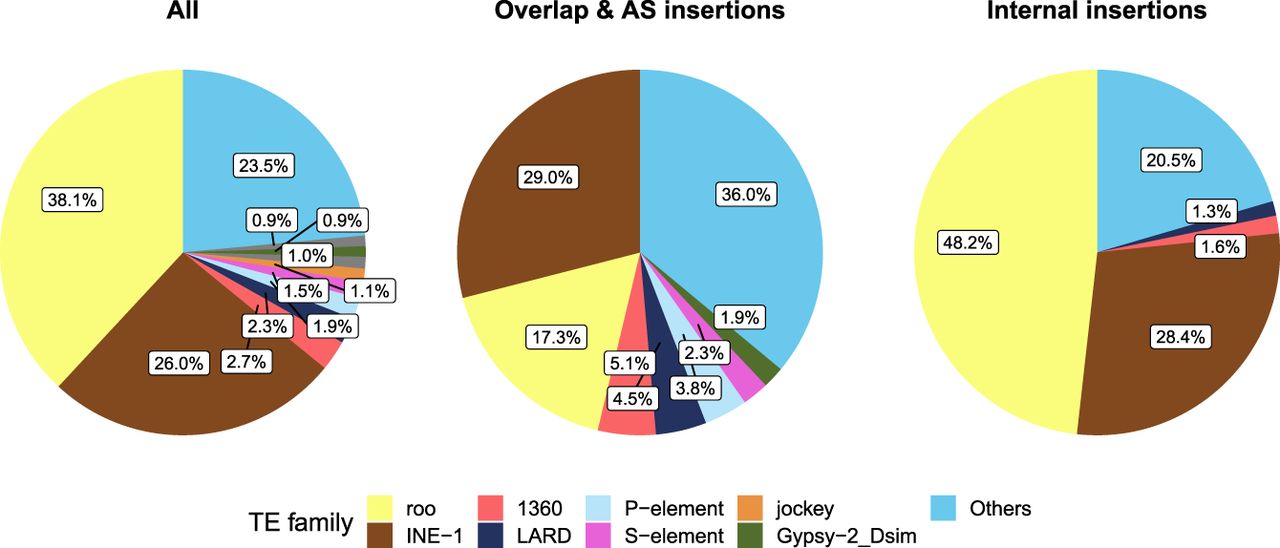
Figure 4.
TE family distribution in gene–TE chimeras, globally and by insertion group. Percentage of TE families contributing to gene–TE chimeras in the global data set (All), in the overlap and AS insertion group, and in the internal insertion group. Only TE families found in more than nine chimeric genes are depicted; otherwise, they are grouped in Others.


